Research products are usually refereed papers and conference presentations. For some projects, the research may be of interest to a general audience, in which case we release an additional research product on the web; we call these Web-Projects.
CEI web-projects

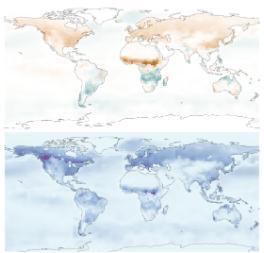
- The Web-Project Global CO2 Flux shows global estimation of CO2 sources and sinks (flux) and their associated uncertainties, obtained from atmospheric CO2 concentration data and sophisticated Bayesian statistical models.
- The Web-Project Warming shows North American temperature change projected in the next 50 years.
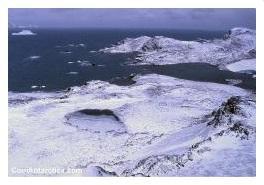
- The Web-Project Ice Streams shows the results of Bayesian hierarchical modelling of ice streams' stress fields and velocity fields.
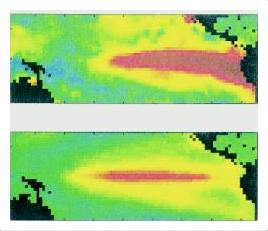
- The Web-Project ENSO (El Nino Southern Oscillation) shows long-lead forecasting of sea surface temperature in the tropical Pacific Ocean.
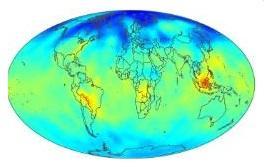
- The Web-Projects TCO (Total Column Ozone) and CO2 (Carbon Dioxide) show daily maps, respectively, of TCO and CO2 values, where each map comes with a second map that visualises its uncertainty.
- The Web-Project STB (Sources to Biomarkers) seeks to characterise multi-pollutant human exposures by linking sources to biomarkers using a hierarchical Bayesian statistical model.
Global CO2 Flux: Bayesian statistical inversion using the WOMBAT framework
Warming: Temperature change projected for North America
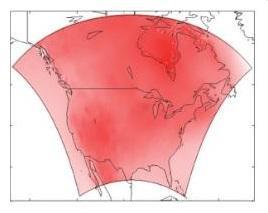
In this Web-Project, we consider a subset of the climate-model experiment associated with the North American Regional Climate Change Assessment Program (NARCCAP). Regional Climate Models (RCMs) are run into the future for small, 50 km x 50 km regions in North America, from which we obtain 50-year temperature-change projections for all regions and all four seasons. The statistical framework to analyse the approximately 100,000 data is based on a Bayesian hierarchical spatial analysis of variance (ANOVA) model that incorporates dimension reduction.
Ice Streams: Understanding the behaviour of ice streams
ENSO: Sea-surface temperature and the El Nino Southern Oscillation
TCO: Ozone mapping
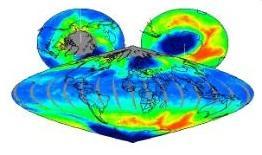
During the 1990s, the patterns in the ozone hole during the Antarctic winter were similar from year to year. In September 2002, the ozone hole split, unlike in any previous years where data were available. Researchers have proposed several theories to explain the 2002 ozone-hole splitting based on a diverse collection of ozone datasets. TOMS is one of the most important resources of total column ozone (TCO) data.
This TCO website shows completed TCO estimates based on the TOMS data and the MRSM, along with a measure of each value's uncertainty. The website also contains brief background descriptions of the MRSM, the atmospheric ozone distribution, and the 2002 ozone-hole splitting event.
CO2: Global mapping of CO2
STB: Sources to biomarkers
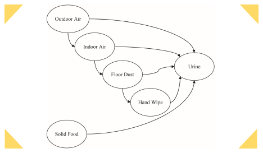 An important problem in human-exposure assessment is to characterise links from sources to biomarkers (STB). In this Web-Project, we use a multi-scale (areal, residential, and personal) Bayesian hierarchical model (BHM), which describes how multi-media pathways contribute to direct routes of exposure (inhalation, ingestion, dermal). The statistical-modelling framework coherently manages and accounts for variability and uncertainty and has explicit stages for sources, areal environmental levels, indoor (residential) environmental levels, personal exposures, and biomarkers. The primary data sources are the National Human Exposure Assessment Survey (NHEXAS) Phase I data from EPA Region 5 (the six Midwest states of Illinois, Indiana, Michigan, Minnesota, Ohio, and Wisconsin) and Arizona, supplemented by census data, ambient-air monitoring data, and emissions data. NHEXAS data provide information to different stages of the model that address areal and indoor environmental conditions, personal exposures, and biomarkers. These stages combine this information in a manner akin to structural-equation modelling to discern pathways and routes of exposure. The results include characterisations of the distribution of biomarkers across the population as a whole and within sub-populations, as well as the relative contribution to biomarkers from various pathways and routes of exposure.