Sources to biomarkers

This Web-Project describes statistical models for pathways of exposure, which were developed by the Sources to Biomarkers (STB) research group (a collaboration of statisticians at The Ohio State University and Battelle). The research was supported by the American Chemistry Council's (ACC) Long-Range Research Initiative under an agreement between the ACC and The Ohio State University; Battlelle was a subcontractor on the agreement. The award resulted from a submission to the EPA's FY2003 STAR Grant program, in response to an RFA titled, "Environmental Statistics Research: Novel Analyses of Human Exposure Related Data," which was jointly funded by the EPA's National Center for Environmental Research (NCER) and the ACC. A description of the models and findings (based on a number of journal articles and conference proceedings) is given below.

Introduction

Exposure pathways refer to the paths by which toxic substances travel from their sources through environmental media to humans or other animals. For many pollutants, there is not a single direct pathway of exposure. Instead, individuals are exposed to toxics through interactions with various media (e.g., soil, air, water, food), and routes of exposure include ingestion, inhalation, and dermal contact.

This Web-Project presents pathways modeling of exposure to toxic heavy metals including arsenic, lead, cadmium, and chromium, using data from Phase I of the National Human Exposure Assessment Survey (NHEXAS). NHEXAS was carried out in the 1990s by the Office of Research and Development (ORD) of the U.S. Environmental Protection Agency (USEPA), along with the U.S. Centers for Disease Control and Prevention (CDC) and the U.S. Food and Drug Administration (FDA). For more information on NHEXAS, see NERL and National Center for Environmental Assessment, 2000. Phase I of the study included a stratified random sample of individuals in Arizona (AZ), EPA Region 5 (the six Midwest states of Illinois, Indiana, Michigan, Minnesota, Ohio, and Wisconsin), and Maryland (MD). Levels of toxics in the environmental media and biomarkers of exposure were collected, as well as demographic and other information about the study participants' diets and activity patterns.

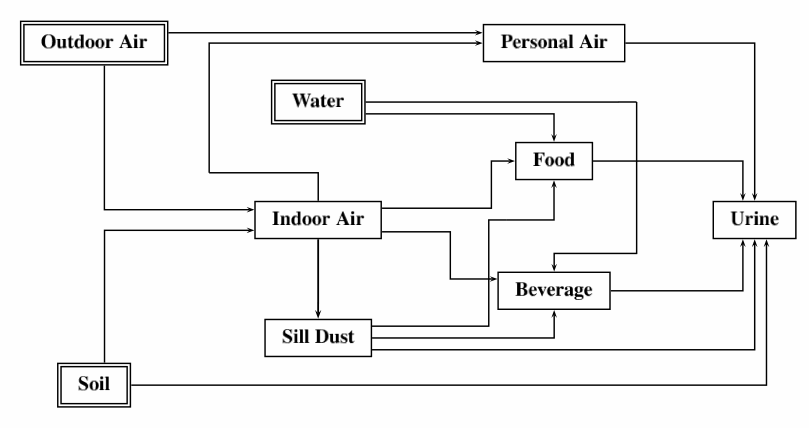
The diagram in Figure 1 illustrates the complex structure of arsenic exposure pathways proposed by Clayton et al. (2002) in a structural-equation-model-based analysis of the NHEXAS data. The boxes represent local environmental media monitored as part of the NHEXAS study and the biomarker of arsenic exposure (urine); and the arrows denote hypothesized direct links between levels of arsenic in two local environmental media or between a local environmental medium and the biomarker. Statistical models based on this structure allow quantification of both direct and indirect relationships between the local environmental media and biomarker. For example, one can quantify both the direct relationship between arsenic levels in soil and the biomarker urine of exposure, as well as the indirect relationship (e.g., via the pathway from soil to indoor air to sill dust to beverage to urine).

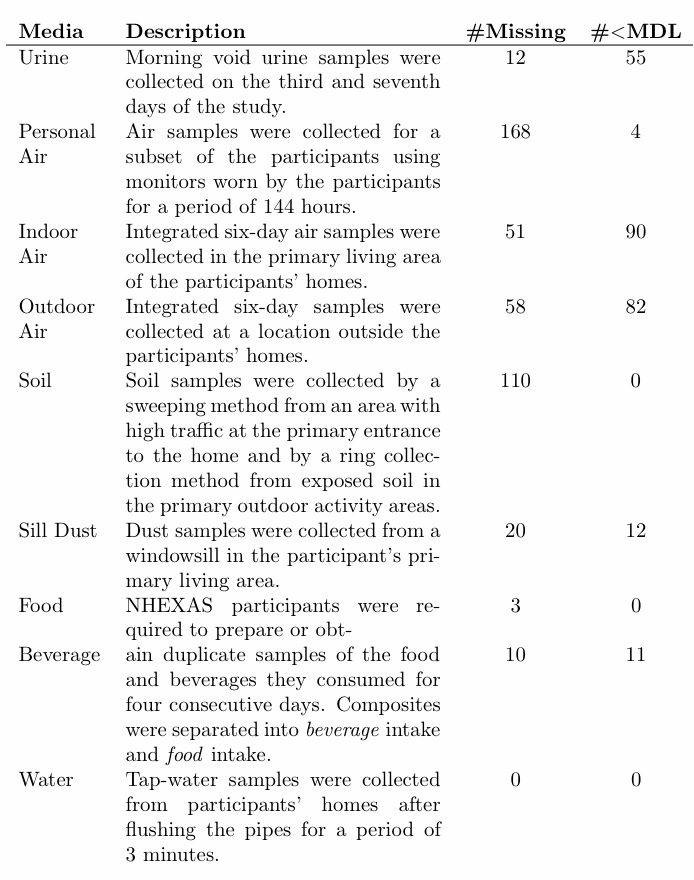
One of the limitations of the NHEXAS data is that a large number of observations are either missing or censored due to concentrations falling below a minimum detection limit (MDL). The table 1 provides the number of missing and censored arsenic measurements of each type for the 178 individuals in the NHEXAS Arizona data. 

In order to be able to learn about pathways of exposure to arsenic in the presence of large amounts of missing and censored observations, the NHEXAS data were supplemented with global environmental media data. These supplemental data sources provide information about the background, (i.e., ambient) concentrations of toxics in environmental media. In the STB analysis of the NHEXAS Arizona arsenic data, the following global environmental media data sources were considered.

 Figure 1: Pathways of exposure to arsenic proposed by Clayton et al. (2002). (Source: Craigmile et al., 2009)

Table 1: Number of missing and censored observations of each type in the NHEXAS Arizona arsenic data. (Source: Craigmile et al., 2009)

Global water data

Measurements of the concentration of arsenic in drinking water were obtained from the Water Quality Division of the Arizona Department of Environmental Quality. These measurements were taken from public water systems (PWS) that service 15 or more connections or 50 or more individuals year-round, and they were active at the time the NHEXAS data were collected. For security reasons, the STB research group was not given the locations of the PWSs; only the percentage of residents of each of the Arizona counties serviced by each PWS was provided.

Global soil data

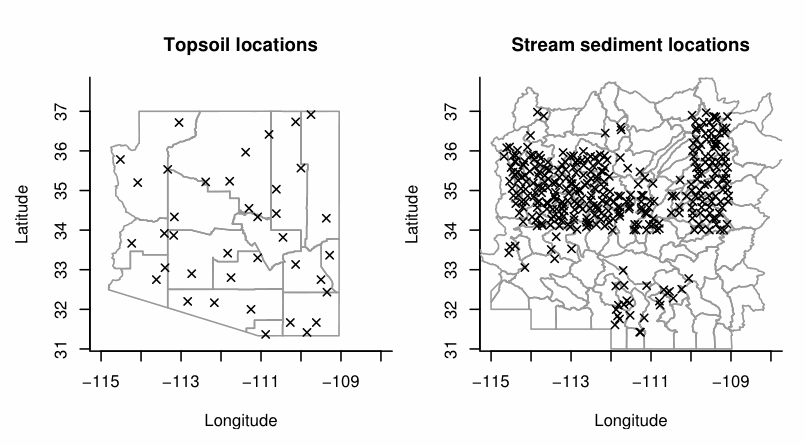
Two sources of background information of ambient levels of arsenic in soil were considered: topsoil measurements from the U.S. Geological Survey's (USGS's) USSoils database and stream-sediment measurements from the USGS's National Geochemical Survey (NGS) database. Each of the stream-sediment measurements was associated with one of 84 hydrologic cataloguing units (HUCs), or watersheds, that cover Arizona. The maps in Figure 2 show the locations of the topsoil and stream sediment measurements, overlaid on a map of the Arizona counties and watersheds, respectively.


Figure 2: Locations of the global-soil observations. (Source: Craigmile et al., 2009)

Global air data

Data from the Interagency Monitoring of Protected Visual Environments (IMPROVE) Network provide information about the background levels of arsenic in the ambient air across Arizona. However, due to the limited temporal overlap between the NHEXAS data and these IMPROVE records, we were not able to make use of this source of global environmental information in the STB analyses.

Bayesian Hierarchical Modeling (BHM) of exposure pathways

Tutorial on Bayesian Hierarchical Modeling for Exposure to Arsenic

Bayesian hierarchical modeling (BHM) provides a probabilistically coherent approach to performing statistical analyses in complex settings. These models can be specified through a series of relatively simple conditional distributions that, when combined, yield the posterior distribution of all unknown model parameters given the observed information. Inferences on model parameters are based on the posterior distribution and reflect all sources of uncertainty considered in the model (e.g., measurement error, model misspecification/process error, and "conflicts" between the data and model structures). The posterior distribution cannot be obtained analytically, and hence the STB analysis used Markov chain Monte Carlo (MCMC) algorithms, allowing posterior inferences on unknowns such as model parameters. For an overview of the structure of a BHM and related computational tools, see, for example, Gelman et al. (2004).

The BHMs built by the STB research group are described in McMillan et al. (2006), Cressie et al. (2007), Santner et al. (2008), and Craigmile et al. (2009). These models are primarily designed to characterize individual-level exposure pathways, and to quantify the strength of the direct and indirect local environmental media/biomarker relationships. In addition, they can be used to examine the extent to which the inclusion of global environmental data refines the uncertainty in the strength of the local environment media/biomarker pathways relationships. The work carried out on the STB project introduced the exposure-science community to Bayesian methodology for analyzing multi-source, multi-pathway exposure data.

The following descriptions give key features of the STB research group's BHMs developed for NHEXAS arsenic data.

Measurement error

The models explicitly account for measurement error in all environmental media and biomarker measurements. For the NHEXAS measurements, the relative standard deviations or the absolute value of the coefficients of variation, which are provided in the NHEXAS documentation, are used to calculate media-specific measurement-error variances.

Missing and censored data

The models account for missing and censored observations using an imputation approach. This approach allows the inclusion all of the NHEXAS participants in the Bayesian analysis, instead of only those with complete data records; and it allows the uncertainty due to lack of complete information in some records to be accounted for.

Global to local to biomarker

NHEXAS Region 5 (Midwest states of Illinois, Indiana, Michigan, Minnesota, Ohio, and Wisconsin) arsenic data came from 249 individuals living in certain sampled counties in the region. As a consequence, a spatial analysis was not feasible. Prototype BHMs were built and fitted; results can be found in the proceedings paper by McMillan et al. (2006) and the STB research group's initial peer-reviewed contribution to the exposure-pathways literature (Cressie et al, 2007). The latter paper's most significant finding was positive regression coefficients along the soil-to-floor-to-dust route of personal exposure. A sub-population BHM analysis in Santner et al. (2008) produced scientifically more relevant conclusions; see Subpopulation analysis below. Spatial information in the NHEXAS Arizona arsenic data was incorporated into the BHMs by Craigmile et al. (2009); see Spatial data misalignment below.

Spatial data misalignment

The STB research group's approach to synthesizing the NHEXAS Arizona (local environmental media/biomarker) arsenic data and the global-environmental-media data was primarily spatial in nature. That is, the global environmental media were thought to provide information about the background levels of arsenic in media proximate to the NHEXAS participants' locations of residence. While NHEXAS participants are associated with their county of residence, the various types of global-environmental-media data are indexed by latitude/longitude coordinates (topsoil), watershed (stream sediment), and PWS (water). To account for the uncertainty due to matching NHEXAS individuals' environmental-media data with global-environmental-media data, mixture models were imbedded in the components of the hierarchy describing the global-to-local-media relationships. For example, the amount of arsenic in an individual's drinking water was assumed to depend most on the arsenic concentration of water from PWSs serving large portions of the population of the individual's county. Further details on this mixture-modeling approach for handling spatial data misalignment are given in Craigmile et al. (2009). In addition, Calder et al. (2009) describe an unweighted spatial statistical approach to combining the ambient topsoil and stream-sediment measurements.

Subpopulation analysis

Santner et al. (2008) give an extension of the exposure-pathways-modeling framework that accommodates subpopulation differences in the strength of the local environmental media/biomarker relationships. This variation on the general modeling framework allows certain model parameters to vary according to individual-level demographic and behavioral characteristics (e.g., age, gender, tobacco usage, and time spent in an enclosed workshop). The subpopulation analysis of the NHEXAS Region 5 arsenic data indicated that arsenic exposure pathways were significantly modified by household size, amount of time spent at home, use of tap water for drinking and cooking, and use of central air conditioning, among others. The results described in Cragmile et al. (2009) for the NHEXAS Arizona data were based on a BHM that did not recognize subpopulations. It would be interesting to do further analyses to see if similar subpopulation results carry over from Region 5 to Arizona.

Arsenic exposure pathways in Arizona

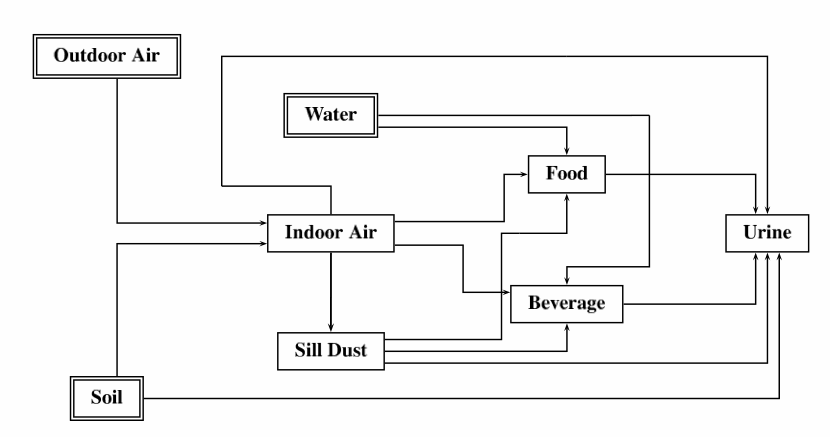
Here, we summarize the results of the BHM analysis of the NHEXAS Arizona arsenic data, presented in Craigmile et al. (2009). Due to a large amount of missing data for the environmental media in the air pathway, Clayton et al. (2002)'s exposure-pathways structure, developed for Region 5, was modified -- see Figure 3 below. The modified structure removes the personal-air data completely, since only six values of this medium were observed. In addition, the direct link between outdoor air and the urine biomarker was removed.

Figure 3: Modified arsenic-exposure-pathways structure. (Source: Craigmile et al., 2009)

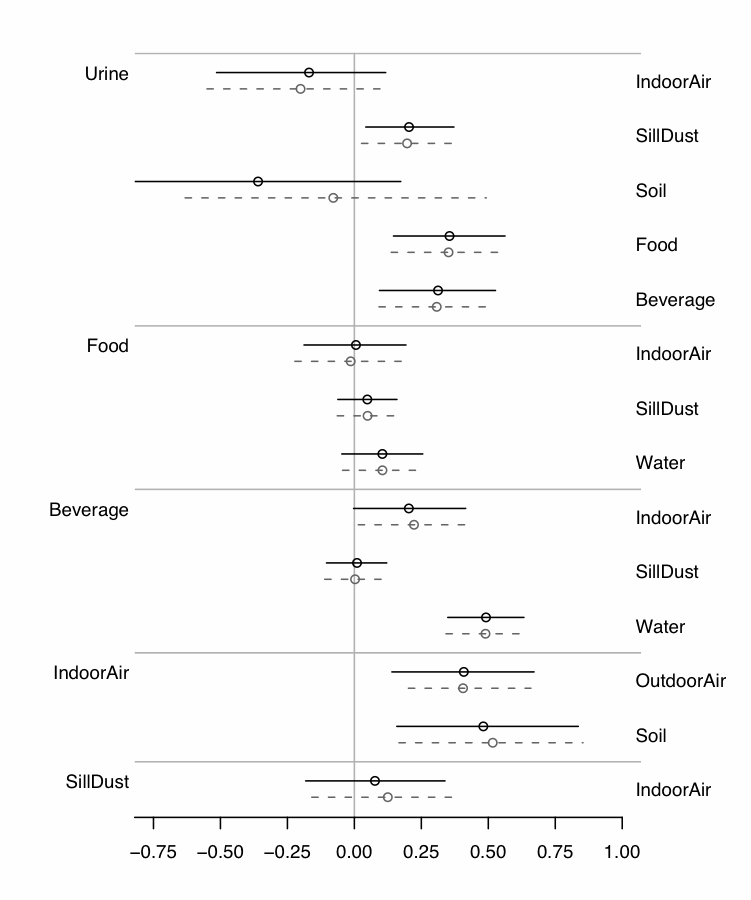
In Craigmile et al. (2009), the parameters of primary interest are regression coefficients, represented by arrows in the diagram above, that describe the strength of the direct local environmental media/biomarker relationships. In Figure 4 below, the posterior means of these model parameters are denoted by circles, and the horizontal lines represent 95% Bayesian credible intervals, which characterize the uncertainty in the parameters. For each parameter representing a direct local environmental media/biomarker relationship, the top credible interval (solid line) and posterior mean (circle) are based on the NHEXAS Arizona data alone, while the bottom credible interval (dashed line) and posterior mean (circle) are based on the NHEXAS Arizona data and the additional global-environmental-media data.

Figure 4: Inferences on model parameters describing the strength of the regression coefficients that are represented by arrows in Figure 3. (Source: Craigmile et al., 2009)

As expected, most of the regression coefficients appear to be positive. While the soil-to-urine coefficient is estimated to be negative, there is a high degree of uncertainty in this estimate, as evidenced by the wide 95% Bayesian credible intervals. Incorporating the global-environmental-media data into the analysis only slightly affects inferences on the parameters of interest.

From a scientific perspective, these findings are not particularly illuminating, although a subpopulation analysis (analogous to that carried out in Region 5 by Santner et al., 2008) might have been. Some comparison of results from Arizona and Region 5 are available in Paul et al. (2007). Ultimately, the sophisticated statistical modeling (using BHMs) employed, and the background information provided by the supplemental global-environmental-media data, were not able to find a strong "signal" in the NHEXAS Arizona arsenic data. The paper by Craigmile et al. (2009) was written to provide a "behind-the-scenes" view of the process of building, fitting, and checking a complex Bayesian hierarchical model; it was featured as an invited discussion paper in Bayesian Analysis.

Calder, C.A., Craigmile, P.F., and Zhang, J. (2009). Regional spatial modeling of topsoil geochemistry. Biometrics, 65, 206-215, DOI: 10.1111/j.1541-0420.2008.01041.x.

Clayton, C. A., Pellizzari, E. D., and Quackenboss, J. J. (2002). National Human Exposure Assessment Survey: Analysis of exposure pathways and routes for arsenic and lead in EPA Region 5. Journal of Exposure Analysis and Environmental Epidemiology, 12, 29-43.

Craigmile, P.F., Calder, C.A., Li, H., Paul, R., and Cressie, N. (2009). Hierarchical model building, fitting, and checking: A behind-the-scenes look at a Bayesian analysis of arsenic exposure pathways (with discussion). Bayesian Analysis, 4 (1), 1-36, DOI:10.1214/09-BA401.

Cressie, N., Buxton, B.E., Calder, C.A., Craigmile, P.F., Dong, C., McMillan, N.J., Morara, M., Santner, T.J., Wang, K., Young, G., and Zhang, J. (2007). From sources to biomarkers: A hierarchical Bayesian approach for human exposure modeling. Journal of Statistical Planning and Inference, 137, 3361-3379.

Gelman, A., Carlin, J. B., Stern, H. S., and Rubin, D. B. (2004). Bayesian Data Analysis, 2nd edn. Boca Raton, FL: Chapman & Hall/CRC.

McMillan, N. J., Morara, M., and Young, G. S. (2006). Hierarchical Bayesian modeling of human exposure pathways and routes. Proceedings of the 2006 Joint Statistical Meetings. Alexandria, VA: American Statistical Association, 2492-2503.

Paul, R., Cressie, N., Buxton, B. E., Calder, C. A., Craigmile, P. F., Li, H., McMillan, N. J., Morara, M., Sanford, J., Santner, T. J., and Zhang, J. (2007). A Bayesian hierarchical model of arsenic exposure based on NHEXAS data: A comparison of US EPA Region 5 and Arizona. Proceedings of the 2007 Joint Statistical Meetings. Alexandria, VA, American Statistical Association, 1055-1062.

Santner, T.J., Craigmile, P.F., Calder, C.A., and Paul, R. (2008). Demographic and behavioral modifiers of arsenic exposure pathways: A Bayesian hierarchical analysis of NHEXAS data. Environmental Science & Technology, 42(15), 5607-5614.