Daily smoothed TCO
Animation
Not available
The animation shows the MRSM-smoothed TCO values during the period, Sept. 6, 2002 - Oct. 26, 2002. Notice that the ozone hole splits in two around Sept. 25, 2002.
Daily observed TCO

Animation
Not available
The animation shows the MRSM-smoothed TCO values during the period, Sept. 6, 2002 - Oct. 26, 2002. Notice that the ozone hole splits in two around Sept. 25, 2002.
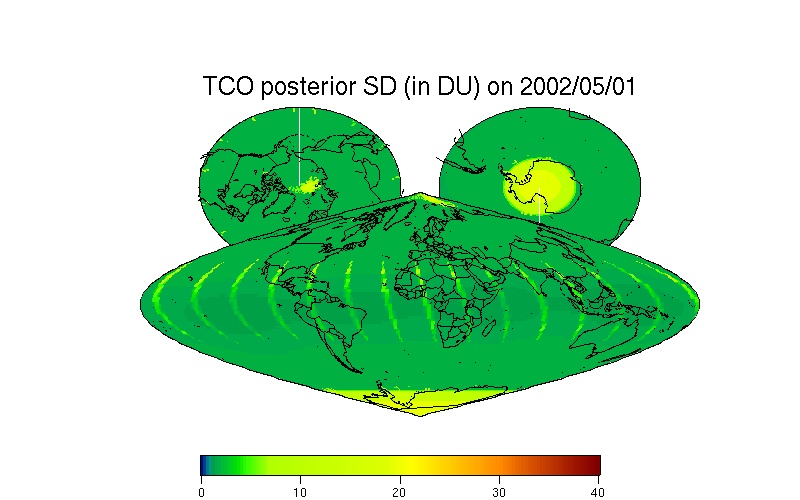
Uncertainty is measured by the pixelwise standard deviations (SD).
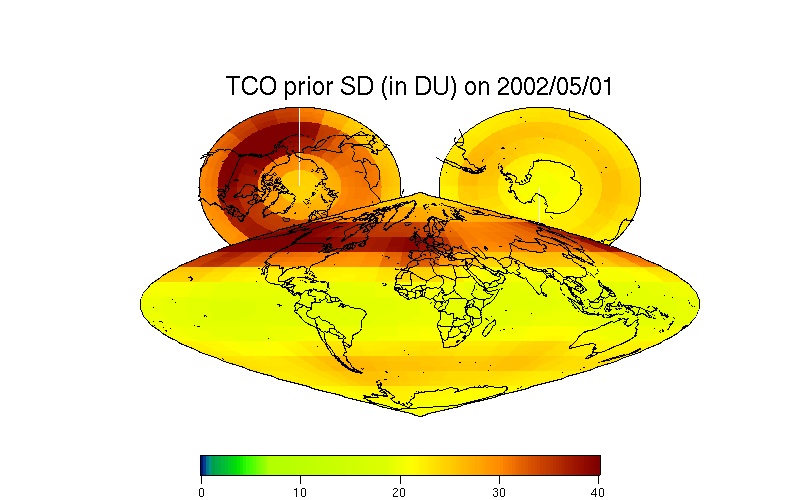
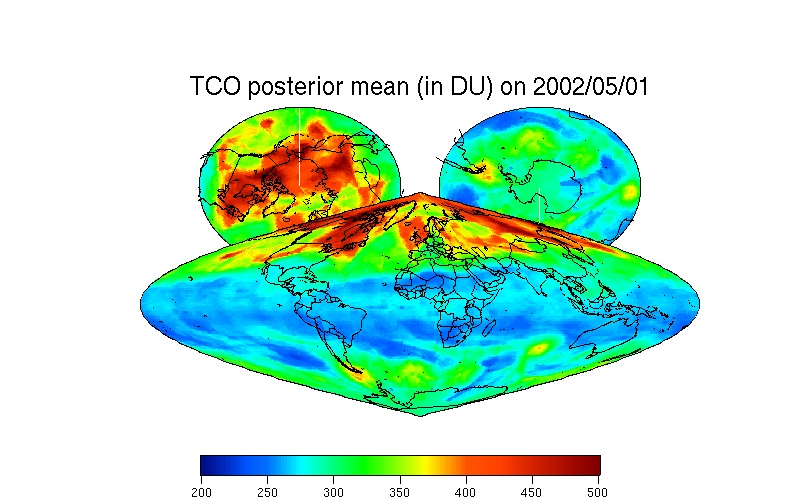
The MRSM combines information in the prior TCO model and information in the TCO data:
After the prior model and the data have been combined, a posterior model is obtained by using Bayes' Theorem. The prior uncertainty (SD) changes to the posterior uncertainty (SD).