School of Business

About us

UOW’s School of Business offers flexible, career-focused education across accounting, economics, finance, management, marketing, and supply chain and business analytics, preparing graduates to make informed decisions in a dynamic global environment. We collaborate with the public and private sectors to produce leading research and teaching that makes a difference. 

Our vision, mission and commitment

Our vision

We will have a positive impact in our local and international communities as an Australian business school committed to responsible and sustainable business practices.

Our mission

The School of Business inspires and develops globally-minded and socially responsible community members and leaders, through high-quality teaching, impactful research and meaningful engagement with community, government, industry and academic partners.

Our commitment to excellence, impact, and sustainability

Excellence in education

At the heart of our School is a deep commitment to excellence. We are proud to hold accreditation from AACSB and various professional bodies, which validate our dedication to student success.
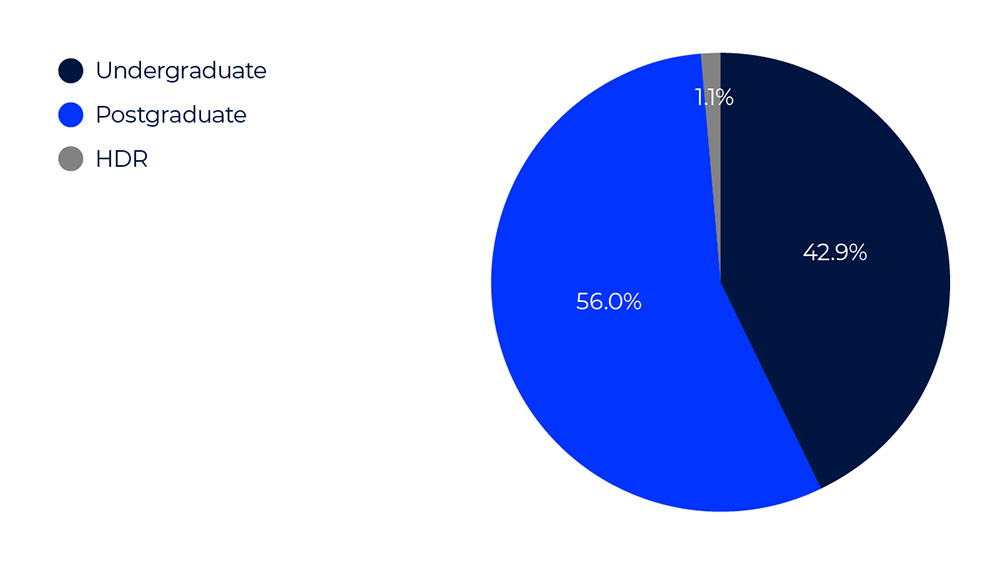
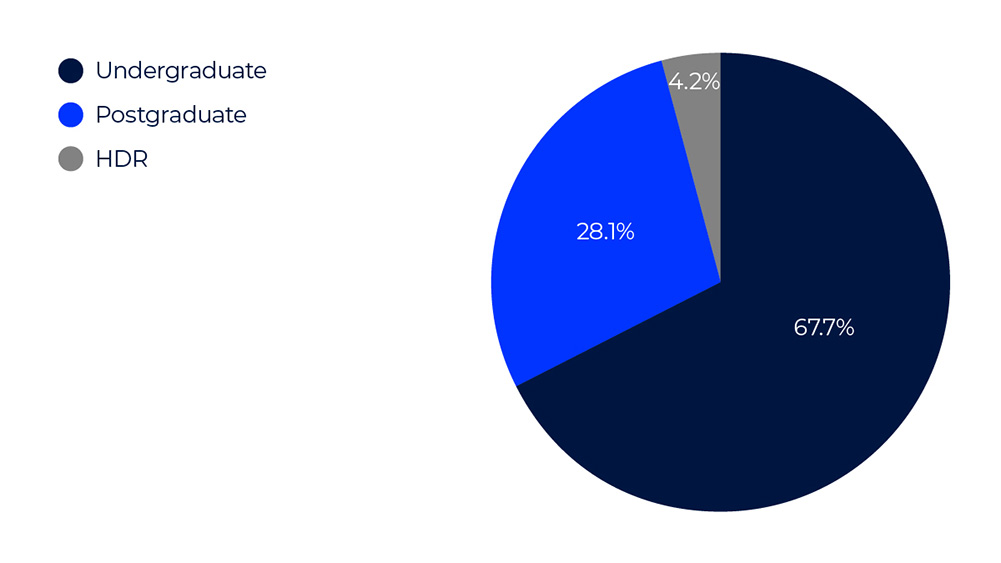
A global perspective

In our interconnected world, a global mindset is essential. We actively foster this through:

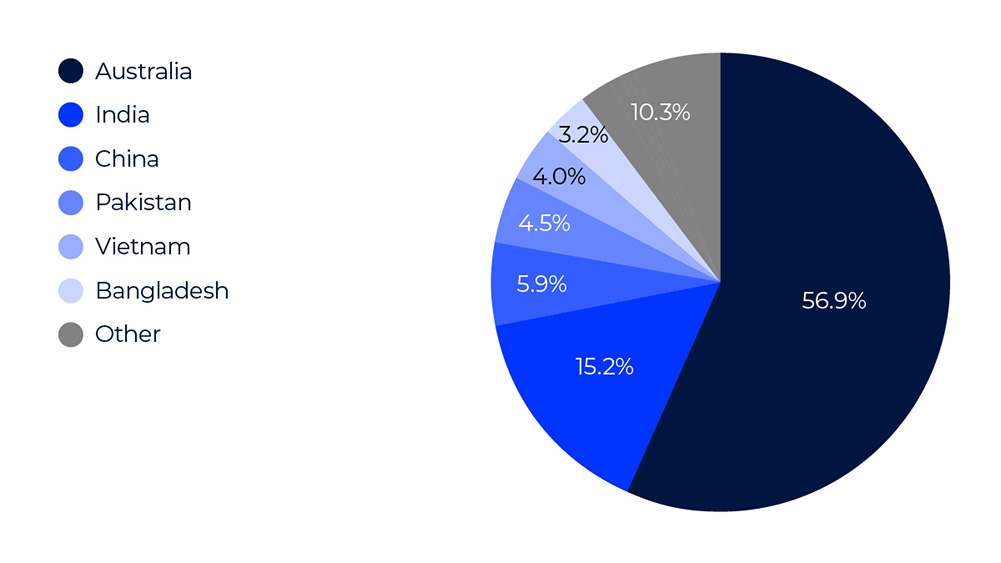
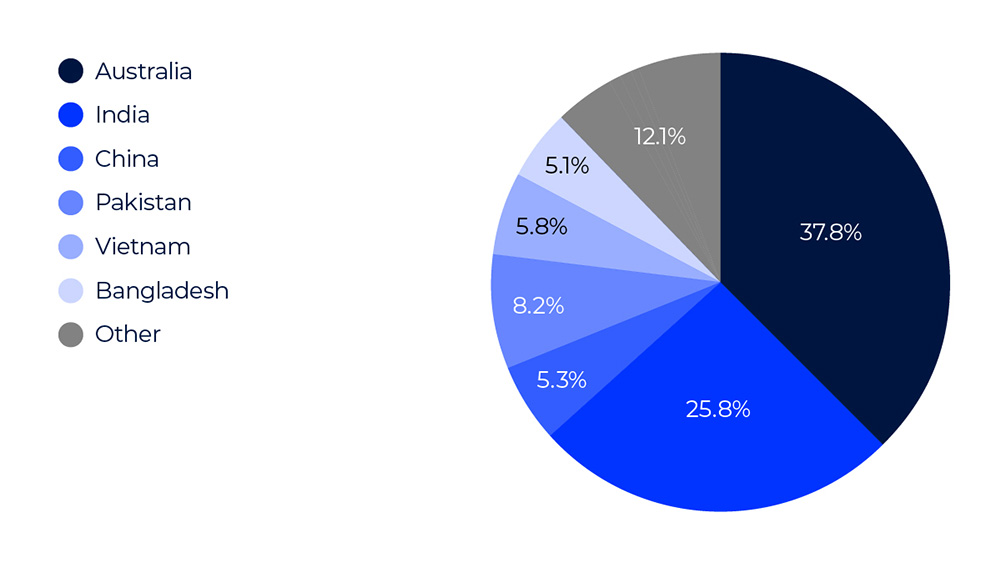
  • International reach: Offering education programs around the world at UOW's global campuses.
  • Worldwide partnerships: Enabling collaborative learning, study tours, and study abroad opportunities for our students.


Shaping a sustainable future

We are leaders in fostering social responsibility and sustainability. Our commitment is guided by the United Nations' Principles of Responsible Management Education (PRME), integrating these critical concepts into all our programs and research.

We invite you to join our community - as a student, researcher, or external stakeholder - and embark on a journey of learning, research, and positive impact. Together, we can shape the future of responsible business leadership.

Our research

Our researchers are at the forefront of their fields, with international reputations in areas such as responsible organisations and practices, cross-cultural management, human and social capital, supply chain research, and Australasian business and economic studies.

Going beyond research, we collaborate closely with community organisations, companies, and government bodies to ensure that our expertise has a positive impact on our communities. Our research candidates engage in rigorous and relevant research, supported by dedicated supervisors.

Free tax assistance for our community

Need help with your tax? The UOW Tax Clinic offers free, confidential help and advice for eligible individuals and small businesses. Our trained student advisers, supervised by registered tax agents, can guide you through lodging your return or responding to the ATO.

Find out if you are eligible

Key facts – students and staff

2023 figures

UOW School of Business Graph 1 Domestic vs. International Students (2023)

Pie Graph Description: Domestic vs. International Students

The pie graph shows the distribution of Domestic and International Students:

  • Domestic Students: make up 56.9% of the total student body. This segment is larger and is shown in navy.
  • International Students: account for 43.1% of the total. This segment is smaller and displayed in royal blue.


UOW School of Business Graph 2 Domestic Students (2023)  Commencing v Continuing


Pie Graph Description: Domestic Students: Commencing v Continuing

The pie graph shows the distribution of Domestic students:

  • Domestic Commencing Students: account for 29.1% of the total. This segment is smaller and displayed in navy.
  • Domestic Continuing Students: make up 70.9% of the total student body. This segment is larger and is shown in royal blue.

UOW School of Business Graph 3 International Students (2023)  Commencing v Continuing

Pie Graph Description: International Students: Commencing v Continuing

The pie graph shows the distribution of International students:

  • International Commencing Students: make up 63.4% of the total student body. This segment is larger and is shown in navy.
  • International Continuing Students: account for 36.6% of the total. This segment is smaller and displayed in royal blue.

UOW School of Business Graph 4 Commencing Student Enrolments in 2023 by Program Level (Undergraduate, Postgraduate, Higher Degree Research)

Pie Graph Description: Commencing Student Enrolments by Program Level

The pie graph illustrates the distribution of commencing student enrolments across different program levels:

  • Undergraduate Level enrolments represent 42.9% of the total. This segment is the second largest and is depicted in navy blue.
  • Postgraduate Level enrolments account for 56.0% of the total. This is the largest segment, shown in royal blue.
  • Higher Degree Research (HDR) Level enrolments constitute 1.1% of the total. This smallest segment is represented in grey.

UOW School of Business Graph 5 Continuing Student Enrolments in 2023 by Program Level (Undergraduate, Postgraduate, Higher Degree Research)

Pie Graph Description: Continuing Student Enrolments by Program Level

The pie graph illustrates the distribution of continuing student enrolments across different program levels:

  • Undergraduate Level enrolments represent 67.7% of the total. This segment is the second largest and is depicted in navy blue.
  • Postgraduate Level enrolments account for 28.1% of the total. This is the largest segment, shown in royal blue.
  • Higher Degree Research (HDR) Level enrolments constitute 4.2% of the total. This smallest segment is represented in grey.

UOW School of Business Graph 6 School of Business Students (2023) by Countries of Origin

Pie Graph Description: School of Business Students by Countries of Origin

The pie graph shows the distribution of School of Business students by their countries of origin:

  • Australia: 56.9% of students, represented in navy blue. This is the largest segment.
  • India: 15.2% of students, shown in royal blue.
  • China: 5.9% of students, depicted in blue.
  • Pakistan: 4.5% of students, illustrated in light blue.
  • Vietnam: 4.0% of students, displayed in sky blue.
  • Bangladesh: 3.2% of students, represented in light grey.
  • Other: 10.3% of students, shown in grey.

UOW School of Business Graph 7 Commencing Students (2023) by Countries of Origin

Pie Graph Description: Commencing Students by Countries of Origin

The pie graph shows the distribution of commencing students by their countries of origin:

  • Australia: 37.8% of students, represented in navy blue. This is the largest segment.
  • India: 25.8% of students, shown in royal blue.
  • China: 5.3% of students, depicted in blue.
  • Pakistan: 8.2% of students, illustrated in light blue.
  • Vietnam: 5.8% of students, displayed in sky blue.
  • Bangladesh: 5.1% of students, represented in light grey.
  • Other: 12.1% of students, shown in grey.

UOW School of Business Graph 8 Gender Distribution of Academic Staff (2023)

Pie Graph Description: Gender Distribution of Academic Staff

The pie graph shows the distribution of gender distribution of academic staff:

  • Females make up 42.4% of the total academic staff. This segment is smaller and is shown in navy.
  • Males account for 57.6% of the total. This segment is larger and displayed in royal blue.