2002 Ozone-Hole splitting - background
Since Farman et al. (1985) published their discovery of the ozone hole over Antarctica, polar ozone-hole events have been regularly recorded, mapped, and analyzed. During the 1990s, the records show that the patterns of the Antarctic ozone hole are similar from year to year. Typically, the ozone hole appears in August, continuously increases in size to a maximum in late September or early October, and then disappears in December.
A more complete description of the ozone-hole event involves the seasonal movement of the global atmosphere (e.g., Schoeberl et al., 1992; Solomon, 1999). Usually, during late March (i.e., Antarctic autumn equinox), the Antarctic atmospheric temperature goes down, and the density of the polar air increases. The pressure along the boundary of the polar region decreases and drives the warmer air in low- and mid-latitude regions to move upwards and towards the poles. Because of the earth's rotation and shape (i.e., the radius of a latitude circle decreases as the latitude increases away from the equator), the winds, also called jet streams, are from west to east and with increasing speed and height in higher latitudes. Finally, the jet streams form a huge westerly circulation in the stratosphere called the polar night jet. Inside the polar night jet is the so-called polar vortex. The warmer air can only move along the edge of the polar vortex, but not enter it. Within the vortex, the cold polar air becomes cooler and cooler with neither warmer air from lower latitudes nor energy from the sun during the polar night. The conditions are made even worse due to the thermal radiation in Antarctica. In the Antarctic winter, the stratospheric temperature is usually below -80oC, which causes the formation of the polar stratospheric clouds (PSCs), a prerequisite for substantial ozone chemical depletion. PSCs accelerate the conversion of some chemical material, such as Chlorofluorocarbons (CFCs), into free chlorine and bromine that can directly destroy ozone molecules. Therefore, the total column ozone continuously decreases until the end of the polar night. During September and October (the Antarctic polar "morning"), the edge of the polar vortex gradually becomes unstable because the energy from the sun changes the atmospheric-temperature distribution and the associated wind pattern. The polar vortex becomes weaker and weaker, and finally breaks down in November. Some researchers explain this process from instability to breakup with the planetary wave or the Rossby wave theory (McIntyre and Palmer, 1983; Polvani and Saravanan, 2000). After the destruction of the vortex, warmer air with much higher ozone concentration enters the polar area and breaks down the ozone hole. In other words, the total column ozone in the region increases to values greater than 220 DU.
While the ozone hole typically has a standard cycle, a series of unusual events occurred in 2002. In September 2002, the polar vortex became so unstable, that a strong jet stream from the mid latitudes broke through the polar vortex and split it into two vortices with each holding a smaller ozone hole. One vortex, with its ozone hole, disappeared in several days. The other one moved polewards and stayed above the polar area until early November. This vortex and its ozone hole were destroyed one month earlier than the normal polar vortex.
The 2002 shrinking and splitting of the ozone hole excited the mass media. For researchers, two important questions needed to be answered:
(1) How can the whole ozone-hole splitting event be explained?
(2) Is the 2002 ozone hole a significant signal of the improvement (i.e., decrease) of ozone loss?
By using three-dimensional ozone data from the TM3DAM model and the wind data from ECMWF model, Siegmund et al. (2004) simulated the 2002 ozone-hole event and explained that the ozone-hole splitting is likely the result of a strong zonal-mean meridional poleward ozone mass flux between 20hPa and 40hPa.
Newman and Nash (2003) analyzed the southern hemisphere stratosphere in the 2001/2002 winter based on the planetary wave theory. They concluded that during the entire 2001/2002 winter the air was much warmer (by up to 15oK) than normal in the mid-latitude region, but only slightly warmer in the polar stratosphere. The planetary waves from the troposphere heated the edge of the polar vortex, and one of the waves was so strong that the zonal wind was diverted and broke through the polar vortex. Therefore, the unusual 2002 wave events is thought to be the main reason for the unusual splitting of the ozone hole.
Although researchers have developed many theories and models to explore the mystery of the ozone layer, ozone datasets have their limitations. Ground-based stations or balloons can observe ozone level at extremely limited locations, and observations from satellites also have some problems. First, the orbits of Polar Orbiting Satellites (POS) result in incomplete coverage of the low-latitude regions. Second, there is no sunlight in the polar region during the polar winter, which is necessary for a POS to obtain TCO data. Third, the POS hardware is always a natural source of noise that masks the signal.
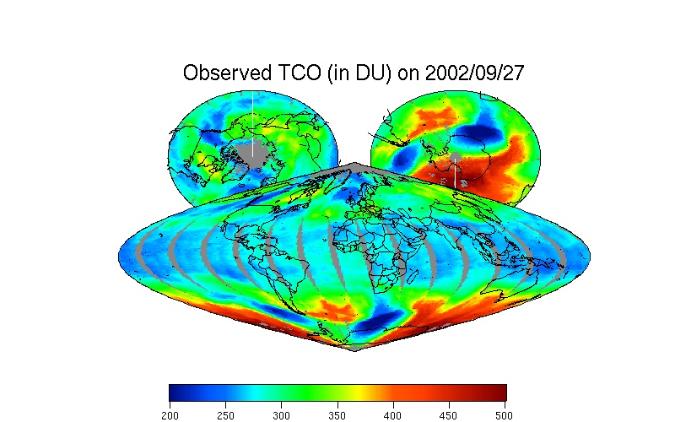
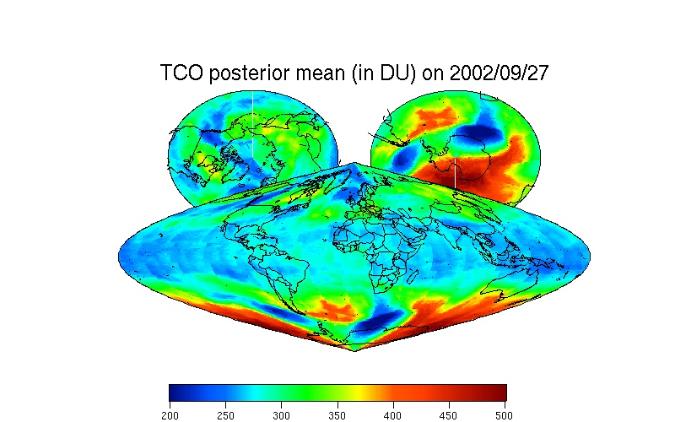
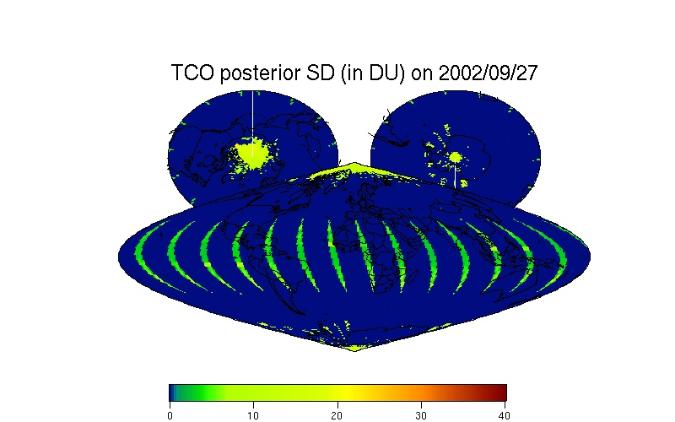
The Multi-Resolution Spatial Model (MRSM) of Johannesson and Cressie (2004) is an effective statistical method for prediction (or smoothing) of spatial processes based on the change-of-resolution Kalman filter (Chou et al. 1994; Huang et al. 2002; Johannesson et al. 2007) and variance-covariance likelihood inference. This TCO webpage shows spatial statistical prediction using the MRSM, for the 2002 ozone-hole-splitting event along with a measure of the uncertainty in each predicted value; see Figures 1, 2, and 3. By using similar procedures, the MRSM can be easily applied in other massive-data-processing scenarios. The purpose of this website is to encourage more researchers to recognize, understand, and apply the MRSM in their own fields.