Motivation

Spectroscopy is a measurement technique that can be used to estimate compositions by observing the interaction of matter and electromagnetic (EM) radiation, such as light. In Raman spectroscopy, the unique spectral signature of a molecule is composed of a series of peaks that correspond to the energy levels of its chemical bonds. Sir Chandrashekhara V. Raman was awarded the Nobel Prize in Physics in 1930 for discovering this method of spectroscopy. More recently, with the advent of lasers and digital image sensors, applications of Raman spectroscopy have become widespread (Ellis et al. 2013; Noonan et al. 2018).

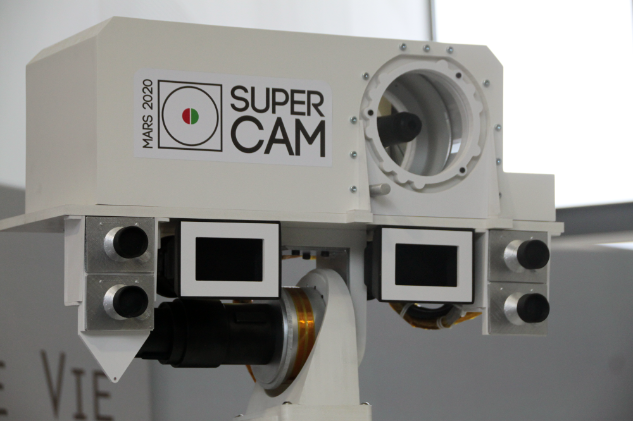
Figure 1: The mast of the Mars 2020 "Perseverance" rover, with the SuperCam instrument (Image credit: NASA)

Scheduled to launch in July 2020, the Mars rover "Perseverance" will be equipped with two Raman spectrometers, SuperCam and SHERLOC. This would be the first time that Raman spectroscopy has been performed on the Martian surface. The goal of this NASA mission will be to search for spectral signatures of biological molecules that might indicate the presence of life on another planet (Hutchinson et al. 2014). We are currently developing Bayesian methods for analysis of Raman spectroscopy, using pre-flight calibration data (Beyssac et al. 2020) as well as spectra from Mars-like environments on Earth, such as the CanMars Mars Sample Return Analogue Deployment (MSRAD) (Stromberg et al. 2019).

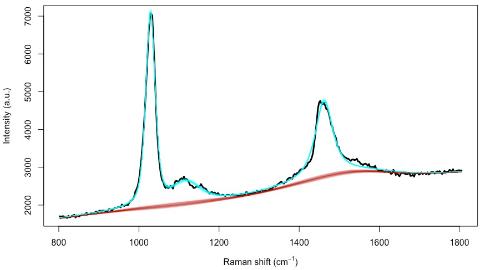
Let $\mathbf{Y}(\tilde\nu)$ be a vector of Raman scattering intensity values that have been discretised at a sequence of wavenumbers $\tilde\nu = (\nu_1, \nu_2, \dots, \nu_J)$. We are mainly concerned with wavenumbers in the range 800 to 1800 inverse centimetres $(\mathrm{cm}^{-1})$, which is the fingerprint region for organic molecules. In a Raman map, these intensity values can also have a spatial location $\mathbf{s}$ in a 2-D or 3-D coordinate system, as well as a time $t$. Then, $\mathbf{Y}(\mathbf{s}, t, \tilde\nu)$ forms a multi-dimensional data cube, which is sometimes referred to as a hyper-spectral observation in the remote sensing literature (Landgrebe, 1999).

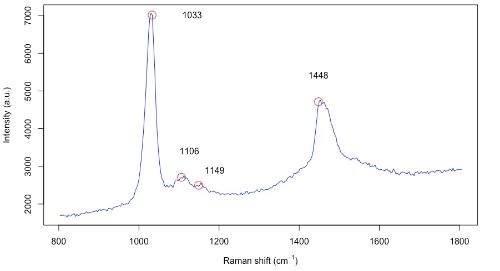
Figure 2: Observed Raman spectrum for methanol, with 4 characteristic peaks at 1033, 1106, 1149 and 1448 wavenumbers.

Sources of uncertainty

The large, nonlinear baseline evident in Figure 2 makes it difficult to accurately estimate the heights of the peaks. This also creates difficulties in quantifying the molecular composition of the sample. Nonlinear interactions between molecules can be caused by preferential attachment (Gracie et al. 2016) or physical matrix effects. In the case of the Mars 2020 “Perseverance” rover, pre-flight calibration measurements can be performed under simulated Martian conditions and compared with spectra from onboard calibration targets (Cousin et al. 2017). 

Proposed model

Moores et al. (2016) modelled the observed Raman spectrum as the sum of three components: the spectral signature $\mathbf{s}(\tilde\nu)$, the baseline $\boldsymbol\xi(\tilde\nu)$, and zero mean, additive white noise $\boldsymbol\epsilon \sim \mathcal{N}(0, \sigma^2_\epsilon)$. That is,

\begin{equation*} \mathbf{Y}(\tilde\nu) = \mathbf{s}(\tilde\nu) + \boldsymbol\xi(\tilde\nu) + \boldsymbol\epsilon \end{equation*}

The spectral line shape of the peaks was represented using Gaussian, Lorentzian, or pseudo-Voigt broadening functions, $h(\tilde\nu; \ell, \varphi)$:

\begin{equation*} \mathbf{s}(\tilde\nu) = \sum_{p=1}^P \beta_p \;h(\tilde\nu; \ell_p, \varphi_p),\end{equation*}

where $\beta_p$ is the amplitude of peak $p$, $\ell_p$ is its location, and $\varphi_p$ is its scale parameter, which controls the broadening of the peak. The pseudo-Voigt function has an additional parameter $\eta_p$ that controls long-range dependence between peaks. Also, the baseline $\boldsymbol\xi(\tilde\nu)$ was represented using penalised cubic spline basis functions.

Inference

We have developed a sequential Monte Carlo (SMC) algorithm (Del Moral, Doucet, and Jasra 2006) to fit this model, as implemented in the R package serrsBayes. SMC, also known as the particle filter, is a simulation-based algorithm that is commonly used in statistical signal processing. The output of SMC is a weighted collection of parameter values, known as particles:

\begin{equation*} \boldsymbol\Theta = \left\{\beta_p, \ell_p, \varphi_p \right\}_{p=1}^P \end{equation*}

The particles $\boldsymbol\Theta$ are initialised by sampling from the prior distributions for the parameters. When the SMC algorithm has converged, these particles represent a random sample from the Bayesian posterior distribution, $\pi(\boldsymbol\Theta \mid \mathbf{Y}(\tilde\nu) )$. Further explanation of SMC is given by Doucet and Johansen (2009) and Särkkä (2013).

Results

Figure 3 shows the observed spectrum (black) as well as 200 posterior samples of the baseline function (red) and the spectral signature (cyan).

Figure 3: Fitted model with pseudo-Voigt peaks.

Reproducible Code

The R package serrsBayes is hosted on the CRAN repository. It has been downloaded more than 7,000 times since it was first made available in February 2018. The README file and the vignettes provide examples of use. The complete R and C++ source code are available from the GitHub repository

Talk

The related talk given by Dr Matt Moores is available here.

Beyssac, O., Ollila, A. M., Arana, G., Bernard, S., Bernardi, P., Cais, P., Castro, K., Clegg, S., Cousin, A., Egan, M., Forni, O., Gasnault, O., Gontijo, I., et al. (2020). “SuperCam Raman onboard Mars 2020 rover: overview and test data.” In proceedings 51st Lunar and Planetary Science Conference, LI:1419.

Cousin, A, S Bernard, G Dromart, C Drouet, C Fabre, T Fouchet, O Gasnault, et al. (2017). “Development of onboard calibration targets for the Mars 2020 SuperCam remote sensing suite.” In Lunar and Planetary Science Conference, XLVIII:2082.

Del Moral, Pierre, Arnaud Doucet, and Ajay Jasra. (2006). “Sequential Monte Carlo samplers.” Journal of the Royal Statistical Society: Series B, 68 (3): 411–36. https://doi.org/10.1111/j.1467-9868.2006.00553.x.

Doucet, Arnaud, and Adam M. Johansen. (2009). “A Tutorial on Article Filtering and Smoothing: Fifteen Years Later.” Handbook of Nonlinear Filtering, 12 (656-704): 3. https://warwick.ac.uk/fac/sci/statistics/staff/academic-research/johansen/publications/dj11.pdf.

Ellis, David I., David P. Cowcher, Lorna Ashton, Steve O’Hagan, and Royston Goodacre. (2013). “Illuminating disease and enlightening biomedicine: Raman spectroscopy as a diagnostic tool.” Analyst, 138 (14): 3871–84. https://doi.org/10.1039/C3AN00698K.

Gracie, K., M. Moores, W. E. Smith, Kerry Harding, M. Girolami, D. Graham, and K. Faulds. (2016). “Preferential attachment of specific fluorescent dyes and dye labelled DNA sequences in a surface enhanced Raman scattering multiplex.” Analytical chemistry, 88 (2): 1147–53. https://doi.org/10.1021/acs.analchem.5b02776.

Hutchinson, I. B., Ingley, R., Edwards, H. G., Harris, L., McHugh, M., Malherbe, C., & Parnell, J. (2014). "Raman spectroscopy on Mars: identification of geological and bio-geological signatures in Martian analogues using miniaturized Raman spectrometers." Philosophical Transactions of the Royal Society A: Mathematical, Physical and Engineering Sciences372(2030), 20140204. https://doi.org/10.1098/rsta.2014.0204

Landgrebe, David. 1999. “Information extraction principles and methods for multispectral and hyperspectral image data.” In Information processing for Remote Sensing, 82: 3-38..

Moores, M., K. Gracie, J. Carson, K. Faulds, D. Graham, and M. Girolami. (2016). “Bayesian modelling and quantification of Raman spectroscopy.” arXiv Preprint arXiv:1604.07299 [stat.AP]http://arxiv.org/abs/1604.07299.

Noonan, J., S. Asiala, G.L. Grassia, N. MacRitchie, K. Gracie, J. Carson, M. Moores, et al. (2018). “In vivo multiplex molecular imaging of vascular inflammation using surface-enhanced Raman spectroscopy.” Theranostics, 8 (22): 6195–6209. https://doi.org/10.7150/thno.28665.

Särkkä, S. (2013). "Bayesian Filtering and Smoothing," Cambridge University Presshttp://www.cambridge.org/sarkka.

Stromberg, J. M., Parkinson, A., Morison, M., Cloutis, E., Casson, N., Applin, D., Poitras, J., et al. (2019). “Biosignature detection by Mars rover equivalent instruments in samples from the CanMars Mars sample return analogue deployment.” Planetary and Space Science, 176: 104683. https://doi.org/10.1016/j.pss.2019.06.007

Authored by M. Moores, 2020.