Reproducibility and visualisation in environmental modelling and inference

Motivation

Sometimes it is easy to get caught up in all the intricacies of the publication process; writing up, submitting, revising, re-submitting and so on. Understandably, the urge is frequently to close off a paper or a chapter as quickly as possible in order to start a new one. Code and data are shrugged off as 'having served their use' and end up being stored on a computer somewhere, only to get misplaced or lost in the process of re-filing several years later. We have all heard of the importance of commenting and organising code and data, however, we should be focused more on the 'permanence' of code and results. It is our firm belief that in a global research environment, where we constantly utilise (many times unknowingly) contributions from others amongst us and those from generations before us, that algorithms used in research papers should be made publicly available, even if the data cannot be for confidentiality reasons. There may be a few cases where even the code cannot be disseminated, in which case snippets of code reproducing some of the results present in a publication should be provided.

There are several advantages of making code reproducible with little effort on behalf of the researcher:

  • It increases transparency. However, it is not an assurance that your code is optimal or even correct for that matter. It is an expression of belief in your research, that you would rather have someone re-use your code and find possible inconsistencies.
  • It increases trust. Making sure your results can be reproduced with ease shows fellow researchers that you have nothing to hide and that there were no hidden 'tricks' needed to get the required results.
  • It ensures permanence. It is easy to replicate results from a script file that you coded on your machine, while you have that same machine and when you remember where the file is. But what about 10 years down the line? Permanence ensures that if someone questions your methods a decade from now you are still able to provide an answer.

To ensure reproducibility, we have developed a protocol that we give here and try to adhere to whenever possible. 
Reproducibility protocol

The protocol described below is specific to the programming language used predominantly at CEI, R Software. It is also based on the book, R Packages: Organize, test, document and share your code, by Hadley Wickham.

  • Organise your code into self-contained functions and put them into an R package. This is the first and most important step of the reproducibility protocol. If possible, write automatic test functions to make sure the interface to the functions is predictable and robust to future modifications. Automatic testing is provided by the package testthat. Packaging functions cannot be over-emphasised; it ensures encapsulation, that they do not implicitly depend on global variables or other script-specific options that may be set.
  • Once your functions are in the package, document them using Roxygen2. The documentation does not need to be as rigorous and organised as required, for example, for a CRAN package, but it needs to be understandable and self-contained. Using Roxygen2 ensures that if the interface to the function is changed, the documentation will too.
  • Keep the data somewhere permanent. If not confidential, put your data in the data folder of your R package or, if very large, in a data repository such as datahub.io, that is especially utilised in your code (or at least commented out for cache purposes). In any case, the raw data should be uploaded and not some modified version of it.
  • Place reproducible script file as a vignette in the R package. Having a vignette reproducing your results is helpful since an output document can be produced showing results and figures. If something is wrong, this can usually be seen at a glance from the output document. If the code takes a long time to run, insert flags in the code that ensure that when in development mode, time-consuming results are cached in the data folder. When not in development mode, these results can be loaded. All one needs to do is then ensure that the script is run once in development mode before consolidation.
  • Use an open-source repository such as Github. This not only ensures permanence of the code, but also accountability. Each change in the code is recorded. When the paper using the code is submitted, you can release a version of the reproducible package. When the paper comes back for corrections, you will probably change the package and the vignette and on re-submission, you will re-version the package. This has several advantages. If you are writing a second paper on the same topic that uses the same function, you do not need to be worried about the results of your previous paper changing since you can always revert to the package version that was submitted with the first paper.
  • Test on several platforms. This is particularly straightforward to do if you have a reproducible package. There is no messing around with Makefiles and compiler-specific options; even if you have source code, the R package will seamlessly install on most platforms with minimal effort. Check the output on each platform and note down any inconsistencies. Make sure that the platform and important versions on the machine used to generate the results are clearly listed on the development Github page. You may also use the package packrat to keep track of package versions. If you are using a high-performance computer (HPC), try at least two HPCs. If this is not possible, then clearly state this in the development page.

Visualisation

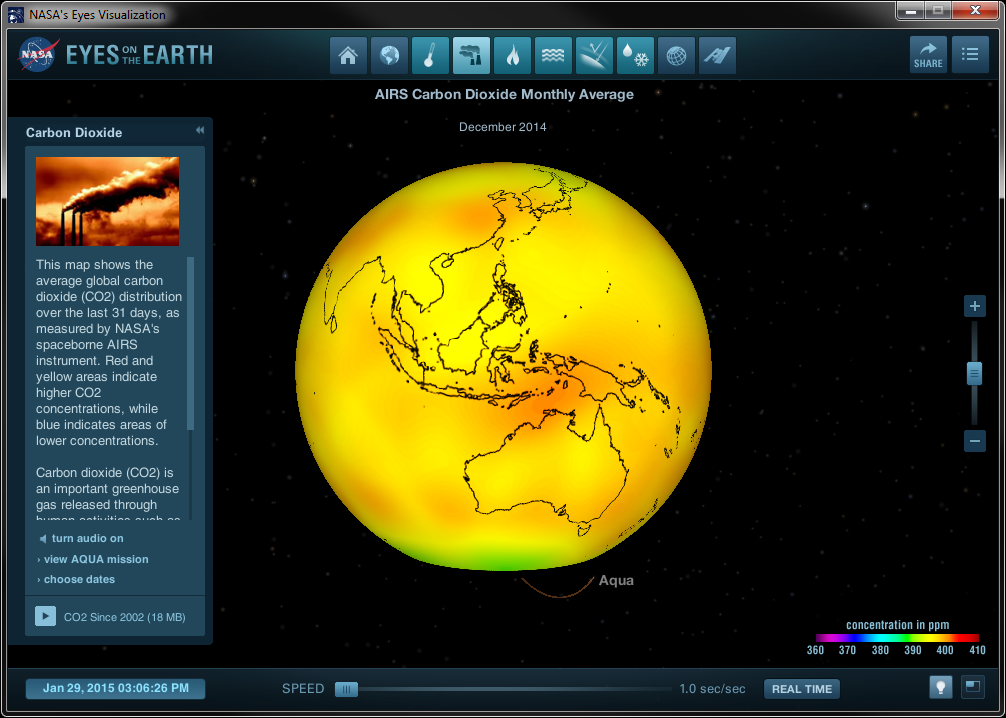
reproducible package is of benefit to a handful of scientists who will wish to reproduce your results in the future. Another aspect of science that follows from reproducibility, is dissemination, and there is no better way to disseminate than through the use of visualisation tools. In CEI, we constantly try to work with and improve visualisations; for example, one of our spatial mapping algorithms, known as Fixed Rank Kriging, was recently incorporated into a product known as Eyes on the Earth. This visualisation tool is the end-product of a close collaboration between CEI and the Jet Propulsion Laboratory, a NASA lab in California, on global mapping of CO2. We show maps of CO2 values from the AIRS instrument below, made using FRK; see Cressie and Johannesson (2008), J. Roy. Statist. Soc., Ser. B.70, 209-226 for details on FRK.

Authored by A. Zammit-Mangion, 2015.