Modern studies of the behaviors of glaciers, ice sheets, and ice streams rely heavily on both observations and physically based models. Data acquired via remote sensing provide critical information on geometry and movement of ice over large sections of Antarctica and Greenland. Though these datasets are significant advances in terms of spatial coverage and the variety of processes we can observe, the physical systems to be modeled are nevertheless imperfectly observed. Uncertainties associated with measurement errors are present, and physical models are also subject to uncertainties. Hence, there is a need for combining observations and models in a fashion that incorporates uncertainty and quantifies its impact on conclusions.
The goal of combining models and observations is hardly new in glaciology, or in the broad areas of the geosciences (e.g., data assimilation as practiced in numerical weather forecasting). We focus on the development of statistical models with strong reliance on physical modeling, a strategy Berliner (2003) called physical-statistical modeling, and then use Bayes' Theorem to make inference on all unknowns given the data. This is different from traditional physical modeling, perhaps with data-based parameter estimates, and traditional statistical modeling, perhaps relying on vague, qualitative physical reasoning.
In the paragraphs that follow, we develop statistically enhanced versions of a simple physical model of driving stress and a familiar model for velocity based on stress. This presentation is based on the preprint, Berliner, Jezek, Cressie, Kim, Lam, and van der Veen (2005).
Glaciological motivations
Since glaciers flow under the force of gravity, important factors in determining velocities include quantities such as the ice thickness acting in combination with forces acting along the sides and at the base of the glacier and under the constraints of the constitutive relationship. In particular, driving stress is associated with gravitational force acting on the ice. Hence, spatial variations in the stress arise from longitudinal gradients in ice-surface elevation and ice thickness. Based on existing theory (e.g., Paterson 1994), we consider equating driving stress to stresses acting on the sides and base of the glacier. A simple approximation equates driving stress along the flow to basal shear stress as follows:
\begin{equation} \tau_{dx} \approx \tau_{bx} = - \rho g H \frac{ds}{dx}, \end{equation} where $s$ is ice-surface elevation, $H$ is the ice thickness, $\rho$ is the density of ice, and $g$ is the gravity constant.
Under these assumptions, it is reasonably straightforward to estimate directly driving stress based on observations of $s$ and $H$. However, even though estimation may be relatively straightforward, assessment of uncertainties in such estimates can be difficult. Furthermore, a concern in estimating driving stress from geometry is that the reliance on the slope of the upper ice surface in (1) implies that results are very sensitive to small-scale variations in surface topography, and to small-scale, perhaps unimportant variations in ice thickness. From (1), there is no theoretical requirement that driving stress be spatially averaged, however it is usually calculated over horizontal distances of a few ice thicknesses or so to eliminate small-scale flow features not important to the large-scale flow (e.g., Kamb and Echelmeyer 1986). Indeed, if averaging is not done, the driving stress estimates exhibit unreasonably large variations.
Data
We assembled surface topography and ice thickness observations for a portion of the Northeast Ice Stream in Greenland; see Figure 1. The data were gathered as part of the Program for Arctic Climate Regional Assessments (PARCA). Surface topography and ice thickness were sampled every few hundred meters using equipment mounted on the Wallops Flight Facility P-3 aircraft. Surface velocity data were calculated by Ian Joughin and provided as part of the PARCA dataset. The three derived datasets are: ${\bf S}$ (Figure 2), surface topography; ${\bf B}$ (Figure 2), basal topography; and ${\bf U}$ (Figure 3), surface velocities.
Bayesian analysis
The primary output of a Bayesian analysis is a posterior distribution, namely, the joint probability distribution for unknown quantities conditional on the observed data. Even in our simple illustration for the Northeast Ice Stream in Greenland, we have on the order of 8,000 unknowns, so explicit presentation of their joint distribution is not feasible. Hence, a key aspect of Bayesian analysis in such high-dimensional settings is the ability to generate realizations (or ensembles) from the posterior distribution; the posterior is then studied through statistical summaries of such ensembles. A separate webpage can be viewed for an introduction to Bayesian Statistics:
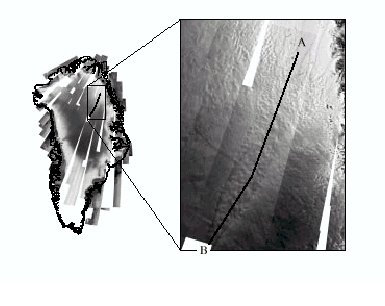
Figure 1. NE Ice Stream Showing PARCA Flight Line.
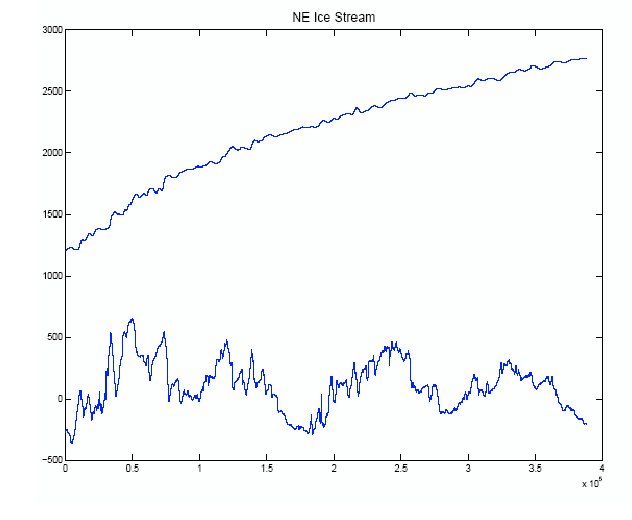
Figure 2. Surface and Basal Elevation.

Figure 3. Surface Velocities.
Physical-statistical modeling of the NE ice stream
Recall that our three datasets are: ${\bf S}$, surface observations; ${\bf B}$, basal observations; and ${\bf U}$, velocity data. The corresponding processes of interest are true surface topography $s(x)$, true basal topography $b(x)$, and true velocities $u(x)$, where $x$ indexes a transect down the middle of the ice stream. There are no observations on the stresses acting on the ice, though, as we shall see, physical relations allow us to make inference on modeled stresses.
Physics
We incorporate three physically based models. First, following the discussion leading to (1), we consider the stress,
\begin{equation} \tau = \rho g H \frac{ds}{dx}, \end{equation} where the ice thickness is $H=s-b$, $\rho$ is the density of ice, and $g$ is the gravity constant. The negative sign present in (1) is omitted here because we model $\tau$ and velocity in the negative-$x$ direction. In all computations, we set $\rho = 911 \, kg/m^3$ and $g = 9.81\, m/s^2$ .
Second, under a laminar-flow assumption and treating the flow parameter $A$ as a constant, the surface velocity $u$ is given by,
\begin{equation} u=u_b + \frac{2A}{n+1} \, H \, \tau^n, \end{equation} where $u_b$ is the sliding velocity and $n$ is a flow parameter (e.g., Paterson 1994, p. 251, eq. 21).
Finally, as suggested by the analysis given in Paterson (1994, p. 243, eq. 8), we consider the following basic model for the surface:
\begin{equation} s= k \, (L^{1+n^{-1}} - (L-x)^{1+n^{-1}})^{0.50 n/(n+1)}\,. \end{equation}
Bayesian hierarchical modeling
We see from Tutorial on Bayesian Statistics for Geophysicists that our main tasks are the development of the following probability distributions: \begin{eqnarray*} \mbox{ Data Model: } & [{\bf B},{\bf S},{\bf U}\mid b,s,u,\mbox{$\boldsymbol \theta$}] & \\ \mbox{ Process Model: } & [b,s,u \mid \mbox{$\boldsymbol \theta$}] & \\ \mbox{ Parameter Model: } & [\mbox{$\boldsymbol \theta$}] & \end{eqnarray*}
where $\mbox{$\boldsymbol \theta$}$ denotes the collection of all model parameters. The specifications of these probability distributions are described in detail in Berliner et al. (2005). Our goal is to obtain the posterior distribution $[b,s,u,\mbox{$\boldsymbol \theta$}\vert{\bf B},{\bf S},{\bf U}]$, which then can be used to obtain the posterior distribution of stresses, $[\tau\vert{\bf B},{\bf S} ,{\bf U}]$.
Our main assumption regarding the data model is that we assume it takes the form \begin{equation} [{\bf B},{\bf S},{\bf U}\mid b,s,u,\mbox{$\boldsymbol \theta$}] = [{\bf B}\mid b,\mbox{$\boldsymbol \theta$}_B][{\bf S}\mid s,\mbox{$\boldsymbol \theta$}_S] [{\bf U}\mid u,\mbox{$\boldsymbol \theta$}_U]\,, \end{equation} where notation such as $\mbox{$\boldsymbol \theta$}_B$ is used to indicate those parameters (subsets of $\mbox{$\boldsymbol \theta$}$ explicitly appearing in the indicated models. A possible objection one might make to (5) is that because the basal data ${\bf B}$ is actually computed as the differences of surface and thickness observations, the assumed conditional independence may not hold. We checked our posterior results for indications of degrees of departure from this assumption and found none that would affect our results. See Berliner et al. (2005) for more details.
Our process model begins with a probabilistic equality (i.e., this is not an assumption, but a fact): \begin{equation} [b,s,u \mid \mbox{$\boldsymbol \theta$}] = [u \mid b,s,\mbox{$\boldsymbol \theta$}] [b, s \mid \mbox{$\boldsymbol \theta$}]. \end{equation} Then assuming that the base $b$ and the surface $s$ are independent conditional on the model parameters, we obtain: \begin{equation} [b,s,u \mid \mbox{$\boldsymbol \theta$}] = [u \mid b,s,\mbox{$\boldsymbol \theta$}_b, \mbox{$\boldsymbol \theta$}_s, \mbox{$\boldsymbol \theta$}_u] [b \mid \mbox{$\boldsymbol \theta$}_b] [s \mid \mbox{$\boldsymbol \theta$}_s]\,, \end{equation} where again notation such as $\mbox{$\boldsymbol \theta$}_b$ is used to indicate appropriate subsets of $\mbox{$\boldsymbol \theta$}$. It is critical to note here that we are not assuming that the base and surface are independent. Our modelling of both the base and surface is conditional upon smooth processes included in definitions of $\mbox{$\boldsymbol \theta$}_b$ and $\mbox{$\boldsymbol \theta$}_s$. Our assumption then is that the small-scale departures from those large-scale processes are independent.
Finally, we turn to the conditional model for $u$ in (7). We assume that the velocity profile depends on the base and surface only through their respective smoothed versions $\mbox{$\boldsymbol \theta$}_b$ and $\mbox{$\boldsymbol \theta$}_s$; that is, \begin{equation} [u \mid b,s,\mbox{$\boldsymbol \theta$}_b, \mbox{$\boldsymbol \theta$}_s, \mbox{$\boldsymbol \theta$}_u] =[u \mid \mbox{$\boldsymbol \theta$}_b, \mbox{$\boldsymbol \theta$}_s, \mbox{$\boldsymbol \theta$}_u]. \end{equation} Once we get this far in the analysis, we assume that the relationship is deterministic (this assumption could be relaxed). That is, the probability distribution on the right-hand side of (8) is degenerate and is based on (3).
The parameter model (i.e., specification of prior distributions) is given in Berliner et al. (2005).
Components of the process model
Bed model
We choose to use wavelets to model the true basal topography (i) because of their flexibility in representing highly variable processes, and (ii) because we can easily control the smoothness of the fitted wavelets. Wavelets do best for equally spaced data where the number of data points is an integer power of $2$. Hence, we partition the domain of the data into $2^{11} = 2048$ bins of equal length ($189.5 \, m$). Let $\bar{{\bf b}}$ denote the 2048-dimensional vector constructed by averaging $b$ within each bin. Note that $\bar{{\bf b}}$ is not observed; define the associated basal data vector $\bar{{\bf B}}$ of length 2048 with $i^{\mbox{\small th}}$ element given by the simple arithmetic average of those basal observations lying in bin $i$. The data model we propose for $[{\bf B}\vert b,\mbox{$\boldsymbol \theta$}_b]$ in (5) implies that the elements of $\bar{{\bf B}}$ are conditionally independent, each being normally distributed with mean equal the corresponding element of $\bar{{\bf b}}$ and variance determined by the measurement error variability of an individual observation, denoted by $\sigma_{B}^2$, and the number of observations in the corresponding bin (see Berliner et al., 2005).
After converting to a discrete wavelet form and fixing the resolution, we obtain a linear model for $[b\vert\mbox{$\boldsymbol \theta$}_b]$ in (7); that is,
\begin{equation} \bar{{\bf b}} \mid \mbox{$\boldsymbol \theta$}_b \sim N({\bf W}{\bf C}, \sigma^2 \mbox{$\boldsymbol \Sigma$}(\phi_{1},\phi_{2})), \end{equation}
where ${\bf W}$ is the $2048 \times k$ matrix of discretized wavelet basis functions, ${\bf C}$ is the $k \times 1$ vector of wavelet coefficients, $s$ is determined by the chosen resolution, $\mbox{$\boldsymbol \Sigma$}(\phi_{1},\phi_{2})$ is the correlation matrix of an autoregressive process of order two (AR(2)) with variance $\sigma^2$, and $\mbox{$\boldsymbol \theta$}_b = ({\bf C},\sigma^2,\phi_1,\phi_2)$. The selection of an AR(2) error model to account for spatial dependence among these model errors (i.e., local variations in basal topography) was based on preliminary data analysis and practicality; our Bayesian computations require repeated inversion of a $2048 \times 2048$ matrix involving the inverse of $\mbox{$\boldsymbol \Sigma$}(\phi_{1},\phi_{2})$, which is simple for an AR(2) process.
Different choices of k lead to different resolutions of the mean basal elevation; we performed analyses for four resolutions, $r=1,\ldots,4$, corresponding to $k=8,16,32$ and $64$ coefficients in (9); see Berliner et al. (2005) for more details.
Surface model
Our modelling strategy for $[s\vert\mbox{$\boldsymbol \theta$}_s]$ in (7), separates the large-scale and small-scale behaviors of the surface. We suppose
\begin{equation} s(x) = s_p(x) + {\cal S}(x), \end{equation}
where the large-scale surface is given by a parameterized function $s_p$, assumed known up to a low-dimensional set of parameters, and $\cal S$ is a zero-mean spatial stochastic process, described in Berliner et al. (2005). To model $s_p(\cdot )$, we rely on the physical model (4); that is, we assume that
\begin{equation} s_p(x) = \mu + K \, (L^{1+n^{-1}} - (L-x)^{1+n^{-1}})^{0.50 n/(n+1)}, \end{equation}
where $\mu, K$, and $L$ are treated as the unknown parameters. In the analysis here, we set $n=3$, though we could model $n$ as an unknown as well.
We use only the large-scale surface (11) to compute ice thickness, the derivative, and hence the stress in (2). Enhancements that incorporate $\cal S$ will be explored elsewhere. Nevertheless, the presence of $\cal S$ is important when determining the data model in (5). Under the modelling strategy that uses (11) to obtain the stress, we need $[{\bf S}\vert s_p,\mbox{$\boldsymbol \theta$}_s]$, which is given in Berliner et al. (2005).
Velocity model
Our data model $[{\bf U}\vert u,\mbox{$\boldsymbol \theta$}_U]$ is again a basic measurement-error model; that is, we assume that conditional on the true velocities, the data vector ${\bf U}$ has a Gaussian distribution with mean equal to the vector of velocities at the corresponding locations, common variances $\sigma_U^2$, and are independent (see Berliner et al., 2005).
Turning to the process model, recall from (8) that we want $[u \mid \mbox{$\boldsymbol \theta$}_b, \mbox{$\boldsymbol \theta$}_s, \mbox{$\boldsymbol \theta$}_u]$ based on (2) and (3). We consider (i) the corresponding smoothed versions of ice thickness, defined as
\begin{equation} {\bf H}= {\bf s}_p - {\bf W}{\bf C}\,, \end{equation}
where ${\bf s}_p$ is the $2048$-dimensional vector of parameterized surface elevations; and (ii) similarly defined smoothed values of stress $\tau$, defined as
\begin{equation} \mbox{$\boldsymbol \tau$}= \rho g ({\bf H}\cdot \frac{d {\bf s}_p}{dx}), \end{equation}
where the right-hand side means each coordinate of the $2048$-dimensional vector $\mbox{$\boldsymbol \tau$}$ is obtained as the elementwise product of the corresponding coordinates of the smoothed thickness and the derivative of the surface.
From (3), we should model ${\bf u}$, the vector of true velocities at the observation locations, as a linear function of the corresponding coordinates of ${\bf H}$ times the $n^{th}$ powers of coordinates of $\mbox{$\boldsymbol \tau$}$. But, in preliminary data analyses, we noted that at least two models (one for small $x$ and another for large $x$) are needed. Let $x=c$ be an unknown change point, and consider different linear functions above and below the change point. Finally, the model for the velocity data vector ${\bf U}$ is
\begin{equation} {\bf U}= \left( \begin{array}{c} u_{b,1} \, {\bf 1}_{1} \\u_{b,2} \, {\bf 1}_{2} \end{array} \right) + \left( \begin{array}{c} 0.50 A_1 \, ({\bf H}\, \cdot \mbox{$\boldsymbol \tau$}^{n})_{1} \\ 0.50 A_2 \, ({\bf H}\, \cdot \mbox{$\boldsymbol \tau$}^{n})_{2} \end{array} \right) + {\bf e}_U, \end{equation}
where the subscripts 1 and 2 indicate the varying dimensions of the vectors ${\bf 1}$ (a vector with all elements equal to 1) and ${\bf H}\, \cdot \mbox{$\boldsymbol \tau$}^{n}$, depending on the value of the change point $c$, and ${\bf e}_U$ are errors primarily representing measurement error associated with the velocity data. See Berliner et al. (2005) for more details.
Bayesian calculations
A separate webpage can be viewed for an introduction to Bayesian statistics: Tutorial on Bayesian Statistics for Geophysicists. Though we can write down Bayes' Theorem for the posterior distribution of all unknowns conditional on the observations, the result is typically not computable in closed form. We use a Monte Carlo approach that produces an ensemble of realizations from the target posterior distribution. The method relies on the emerging technology of Markov Chain Monte Carlo (MCMC). The idea of MCMC is to simulate a Markov chain that has been carefully designed so that its stationary distribution coincides with the target posterior distribution. It follows that, after a burn-in or transience period, the generated realizations of the chain comprise a simulated sample from the posterior. Data analysis (often known as "output analysis") is performed on this sample to produce the desired inferences. In our case, direct use of MCMC is quite challenging, primarily due to the nonlinearities present in (2) and (3). Hence, we combine MCMC with the technique of Importance Sampling Monte Carlo (ISMC). The basic idea of ISMC begins with a setting in which direct simulation from a target distribution is difficult or inefficient. One generates an ensemble from another, more manageable distribution. The theory of ISMC provides formulas for the calculation of weights that are used to reweight the ensemble, permitting inferences relative to the original target. General introductions to both MCMC and ISMC can be found in Robert and Casella (1999). An illustration of these technologies in a geophysical problem is given in Berliner, Milliff, and Wikle (2003).
An outline of the calculations used here goes as follows. We first run separate, independent MCMC algorithms for the basal model and the surface model. These runs produce ensembles from the posterior distributions $[b, \mbox{$\boldsymbol \theta$}_b, \mbox{$\boldsymbol \theta$}_B \mid {\bf B}]$ and $[\mbox{$\boldsymbol \theta$}_s \mid {\bf S}]$. Due to the various conditional-independence assumptions described above, these ensembles are summaries of the posterior distribution of the unknowns conditional on the two datasets ${\bf B}$ and ${\bf S}$. They are then used in conjunction with the velocity model $[u \mid \mbox{$\boldsymbol \theta$}_b, \mbox{$\boldsymbol \theta$}_s, \mbox{$\boldsymbol \theta$}_u]$ (recall (8)) to simulate velocities conditional on ${\bf B}$ and ${\bf S}$. To incorporate the velocity data ${\bf U}$, we reweight all of these samples using ISMC results.
Bayesian-analysis results for the northeast ice stream, Greenland
Posterior results
For each of the four resolutions, Figure 4 presents 10 realizations of the smoothed base ${\bf W}{\bf C}$, superimposed on the original data. We see that the posterior distributions of the smoothed base are increasingly faithful to the basal data as the resolution is increased. We tried even higher resolution wavelets, but detected very little difference from the results for r = 4.
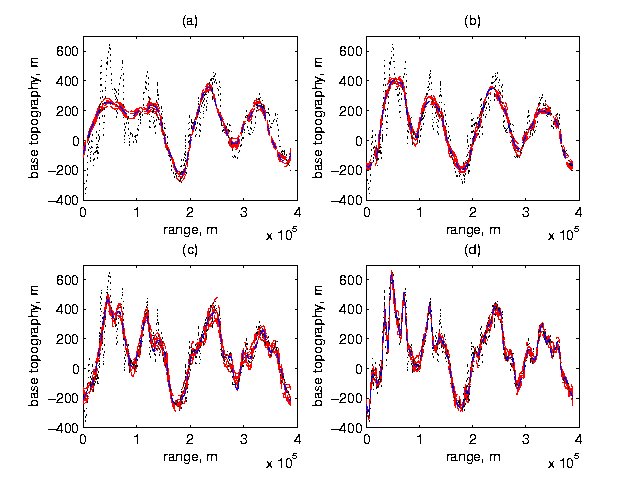
Figure 4. Posterior Smoothed Basal Topographies at Each Resolution. Shown are basal data and 10 posterior realizations of smoothed basal topographies for (a) r = 1, (b) r = 2, (c) r = 3, (d) r = 4.
For each of the four resolutions, Figure 5 presents 50 realizations and the posterior mean, estimated using ensembles of size 2000, of the smoothed stresses $\mbox{$\boldsymbol \tau$}$ (recall (13)). For each resolution, Figure 6 presents 100 realizations and the posterior means estimated using ensembles of size 2000; the original velocity data is also shown in each plot. Note that the change point at x = 77.5 km is clearly seen in these graphs.
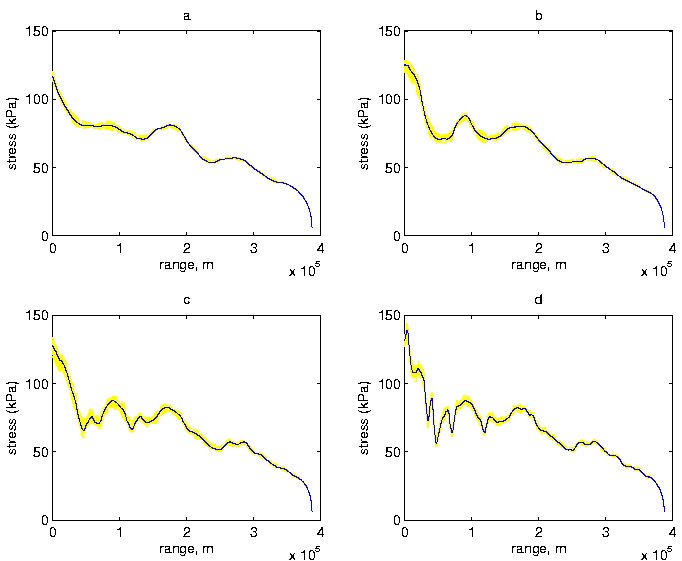
Figure 5. Posterior Realizations of Smoothed Stress $\mbox{$\boldsymbol \tau$}$ at Each Resolution. Shown are 50 posterior realizations of smoothed $\mbox{$\boldsymbol \tau$}$ (kPa) and posterior mean of $\mbox{$\boldsymbol \tau$}$ based on 2000 realizations for (a) r = 1, (b) r = 2, (c) r = 3, (d) r = 4.

Figure 6. Summaries of Posterior Distributions for Velocities. Shown are 100 posterior realizations of velocity profiles and their posterior means based on 2000 realizations for (a) r = 1, (b) r = 2, (c) r = 3, (d) r = 4, as well as the original velocity data.
The estimates (i.e., posterior means) for the other parameters in the model of the large-scale surface elevation (11) are $\hat{\mu}=-450.53$, $\hat{K}= 4.75$, and $\hat{L}= 444901$. Prior and posterior means for other key model parameters are presented in Berliner et al. (2005).
Model assessment
Variance estimation and model selection
We estimated $\sigma_U^2$ as follows. For each of our 2000 simulated ensemble members, we compute the variance, say $v_{m}^2$, where the subscript m indicates the ensemble member) of the "residuals", namely the observed velocity data minus the generated velocities from the m-th ensemble. The average then provides a posterior estimate of $\sigma_U^2$ (due to the very large sample sizes, the prior distribution on $\sigma_U^2$ "washes out"). For each resolution, the resulting estimate of $\sigma_U^2$ is about 50, corresponding to a standard deviation of about 7-8 m/yr. This compares fairly well to the suggestion that most measurement errors in velocity data are expected to be less than 10 m/yr (Goldstein, Engelhardt, Kamb, and Frolich 1993).
To check on the plausibility of the treatment of $\sigma_U^2$ as a constant, we partitioned the length of our profile into eight subintervals and estimated $\sigma_U^2$ as described above, but from data restricted to the subintervals. The results are summarized in Figure 7. First, we find evidence that the magnitudes of the variations around the model differ substantially on either side of the change point. In particular, we see very large variances to the left of the change point, suggesting a severe (and anticipated) breakdown of the laminar-flow approximation. Indeed, the model predicts increasing velocities when approaching the change point from the left and decreasing velocities to the right, whereas the velocity observations decrease relatively smoothly from left to right through this region. Also, we note differences in $\sigma_U^2$ throughout the profile. This suggests looking more closely at local behavior of the velocities. For example, a model with mutliple change points (i.e., corresponding to multiple, local values of sliding velocity and flow parameter A) could be suggested.
Beyond assessments of local model misfit, Figure 7 also contains information regarding comparisons of the resolutions used for basal smoothing. Focusing on the region to the right of the change point, we note that resolution r = 2 would be the preferred choice even though it appears to severely smooth some features of the basal topography (recall Figure 4).
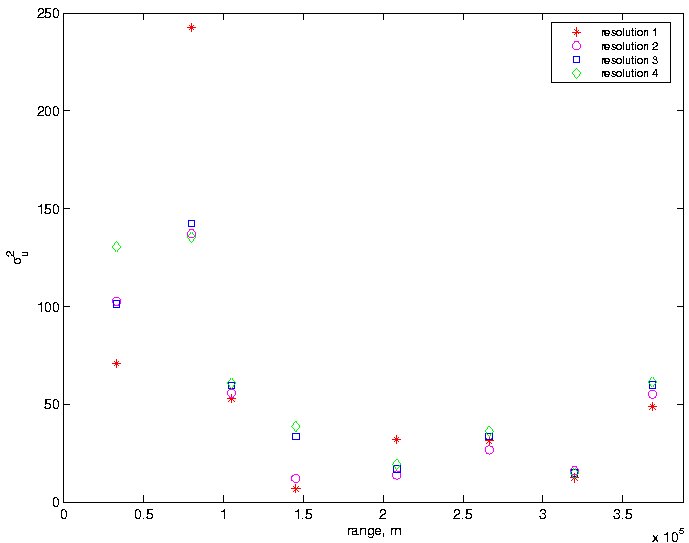
Figure 7. Local Estimates of $\sigma_U^2$. Estimates of $\sigma_U^2$ using data restricted to eight subregions for each resolution r = 1,...,4.
Model stability and predictive power
To assess both model stability and predictive power, we did two simple experiments. First, we re-ran the velocity model using only 20% of the velocity data (every fifth observation). The resulting analyses are reported in Figure 8. In comparing this figure to Figure 6, we find fairly strong similarities, suggesting good stability and interpolation properties. To quantify the behavior, we computed an estimate of the predictive variance of the velocity. Specifically, for the velocity data left out of the analysis, we computed the average squared prediction errors (observed value minus posterior mean). We obtained the value of 50, which compares very well with our estimates of $\sigma_U^2$ based on all the data.
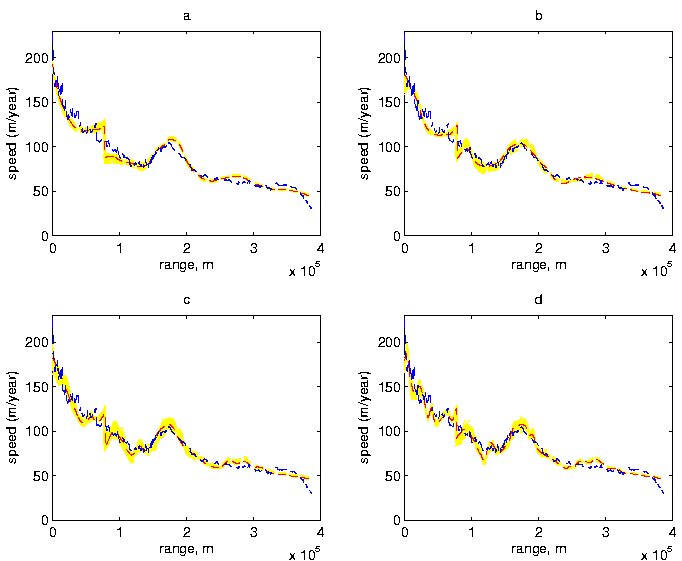
Figure 8. Posterior Distributions for Velocities for Subsampled Data. Bayesian analysis using only every fifth velocity data point. Shown are 100 posterior realizations of velocity profiles and their posterior means based on 2000 realizations for (a) r = 1, (b) r = 2, (c) r = 3, (d) r = 4, as well as the original velocity data.
Second, we again repeated the analysis leaving out some velocity data, but in this case we omitted all observations occurring between x = 148 km and x = 202 km. The posterior results are shown in Figure 9. Models for resolutions 2,3, and 4 do reasonably well even at predicting velocities in the unobserved region. However, the additional smoothing associated with r = 1 leads to very poor predictions in this region. Note that the spreads in the ensemble members are larger than in Figure 3, reflecting the extra uncertainty. It is also interesting that the models appear to systematically predict slightly larger velocities in the unobserved range compared to both the observed velocities and the Bayesian analyses incorporating that data, though r = 2 again does the best job in this region.
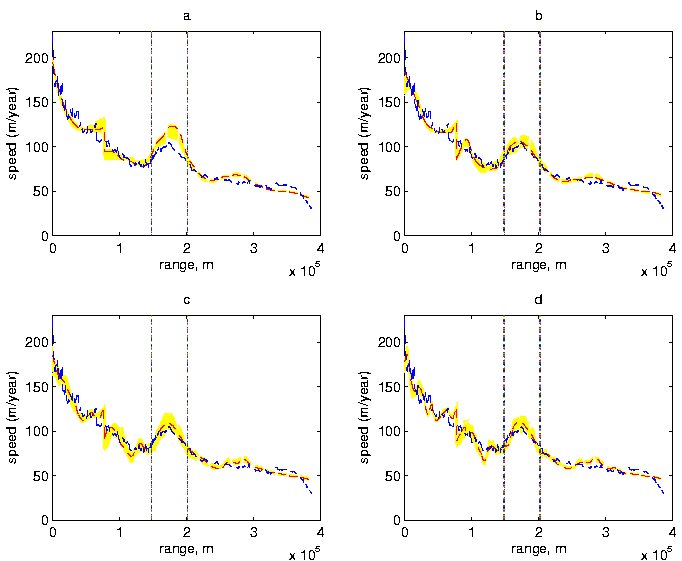
Figure 9. Posterior Distributions for Velocities with Region Omitted. Bayesian analysis using no velocity data from the range x = 150 km to x = 200 km; shown are 100 realizations of posterior velocity profiles and posterior means of velocities based on 2000 realizations for (a) r = 1, (b) r = 2, (c) r = 3, (d) r = 4, as well as the original velocity data.
Surface model
We now address briefly the issue of changing the amount of smoothing of the surface. In a straightforward analysis, where we did no Bayesian or spatial modeling, we fit a very simple class of local smoothing models to the original surface data. We then examined the differences between these fits and a single smoothed function, looking for systematic differences locally in space. The most interesting region corresponds to x ≥ 250 km. Note that from our Bayesian analysis, there are systematic errors in this range: from 250-300 km we overestimate the velocity, and from 300-390 km, we underestimate the velocity. These regions correlate very well with regions in which our smoothed surface derivative underestimates and then overestimates, respectively, the surface derivative obtained from the local fit. However, using such local surface models degrades the velocity model in other regions. Ultimately, we should smooth both the surface and the base interactively.
Acknowledgements
This research was supported by the National Science Foundation, Office of Polar Programs and Probability and Statistics Program, under Grant No. 0229292.
Berliner, L.M. (2003). Physical-statistical modeling in geophysics. Journal of Geophysical Research, 108(D24), 8776, doi: 10.1029/2002JD002865.
Berliner, L.M., Jezek, K., Cressie, N., Kim, Y., Lam, C.Q., and van der Veen, C.J. (2005). Physical-statistical modeling of ice-stream dynamics. Department of Statistics Preprint No. 759, The Ohio State University.
Berliner, L.M., Milliff, R.F., and Wikle, C.K. (2003). Bayesian hierarchical modeling of air-sea interaction. Journal of Geophysical Research, 108(C4), 3104, doi:10.1029/ 2002JC001413.
Goldstein, R.M., Engelhardt, H., Kamb, B., and Frolich, R.M. (1993). Satellite radar interferometry for monitoring ice sheet motion: Application to an Antarctic ice stream. Science, 262, 1526-1530.
Kamb, B., and Echelmeyer, K.A. (1986). Stress-gradient coupling in glacier flow: I. Longitudinal averaging of the influence of ice thickness and surface slope. Journal of Glaciology, 32, 267-284.
Paterson, W.S.P. (1994). The Physics of Glaciers, 3rd edn. Butterworth-Heinemann, Wolburn, MA.
Robert, C.P. and Casella, G. (1999). Monte Carlo Statistical Methods. Springer-Verlag, New York.
This page originally appeared at www.stat.osu.edu/~sses/collab_ice.html