This resource will provide an overview of Microsoft Excel. In the sections below, we will define some key terms, describe the layout of Excel and explain how to insert a formula, function and chart into a worksheet.
What is Microsoft Excel?
Microsoft Excel is spreadsheet software that allows you to organise, format and calculate data using formulas provided by the software, which is broken up by numbered rows and lettered columns.
What can you use Microsoft Excel for?
You can use Microsoft Excel to store, manage and analyse quantitative data, to create graphs and charts, to perform calculations and for financial purposes, such as budgeting.
At university, you might be required to use Microsoft Excel when analysing quantitative data or generating charts for reports and other assessments.
Glossary of terms
|
Cells |
Cells are the rectangular shaped boxes which you can insert information into in the worksheet. A ‘cell reference’ is the combination of the corresponding letter and number of the cell – for example, A1. |
|
Formula |
A formula in Excel executes calculations and other actions. A formula always begins with an equals (‘=’) sign and is entered into a cell. Excel will calculate the answer to the formula and display it in the corresponding cell. An example of a formula is ‘=5+3’. When you press enter on your keyboard, Excel will add these two numbers together and the number ‘8’ will appear in the cell. |
|
Function |
A function is a formula that Excel has prewritten for you, and can be used easily by typing in a word or acronym. Functions exist for a lot of common formulas, including addition, subtraction and averaging. An example of a function is SUM, which when used looks like ‘=SUM(A1:A3)’. When you press enter on your keyboard, Excel will add together the data in range and the result will appear in the cell. |
|
Range |
A range in Excel refers to a collection of cells. In the example above, the range of cells is indicated in by ‘A1:A3’, which informs the program to use the data in cells A1, A2 and A3. |
|
Worksheet |
An Excel worksheet is the area made up of columns, rows and cells in which you enter information. |
|
Workbook |
A workbook is a collection of worksheets. At the bottom of a worksheet, you will see the name of your worksheet, and a plus sign which allows you to add another worksheet to your workbook. When you save your work in Excel, it is saved as a workbook. |
Navigating Excel
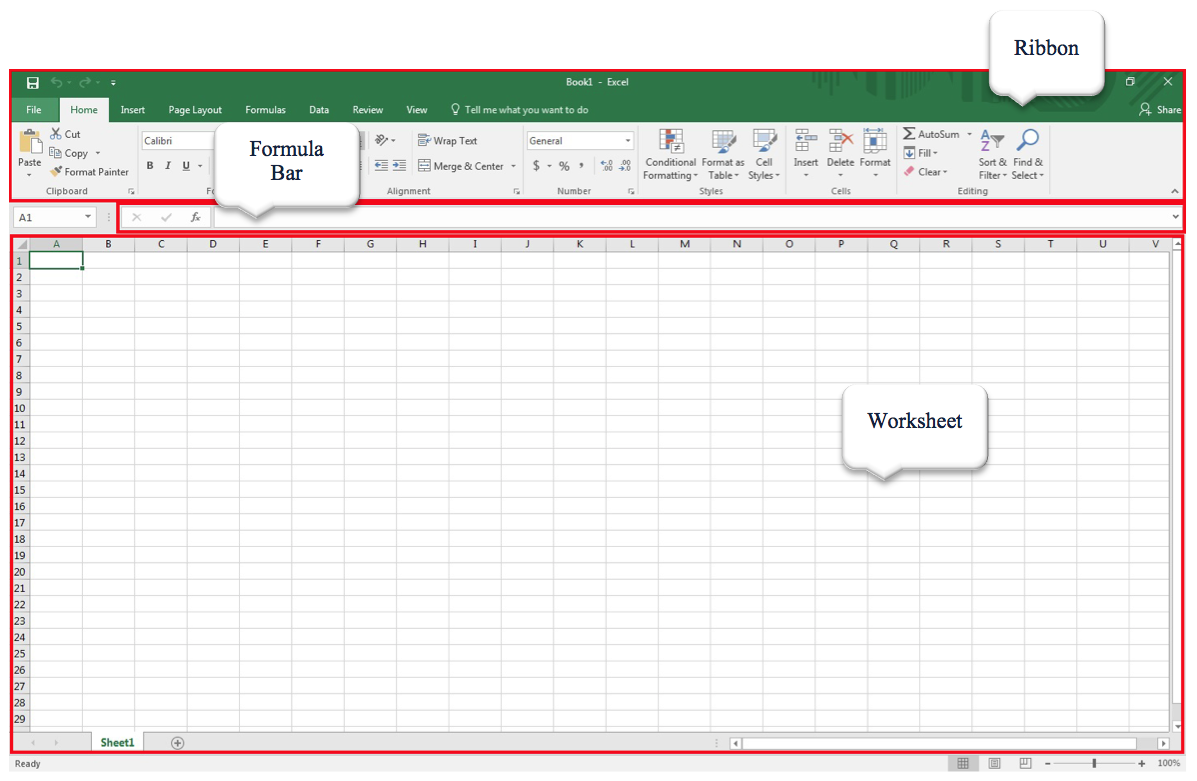
NOTE: This is an image of Excel opened on a computer using the Windows operating system. The layout of Excel will appear slightly differently on a computer using macOS.
|
Ribbon |
The Ribbon in Excel contains the common Microsoft Program tabs detailed in our ‘Microsoft Office’ resource, as well as the Formula and Data tabs.
|
|
Formula Bar |
The Formula Bar is used to view and edit formulas. When you click on a cell that has a formula attached to it, the formula will appear in the formula bar. You can also type a formula directly into the formula bar when applying it to a cell. |
|
Worksheet |
The Worksheet is the area where you enter information. |
Creating a Workbook in Microsoft Excel
To create a new workbook in Excel, click on ‘New’ in the File tab. The window that appears will look like the one above.
|
Adding information or data |
To add information to your worksheet, click on the cell you would like to enter it into and type in the information. When you are finished, press ‘Enter’ on your keyboard, or click on another cell or area. You can format the information you enter by using the formatting tools in the Home tab. |
|
Using formulas |
To enter a formula in Excel, you must enter an equal sign ‘=’ at the beginning. If you want Excel to perform a simple calculation, you can enter either numbers or cell references and the relevant math symbol (see below for a list) and press the ‘enter’ symbol on your keyboard. The solution to the formula will appear in the cell. You can view and edit a formula by selecting the cell, and editing the formula in the Formula Bar. ExampleTyping ‘=A1+A2’ into a cell will result in the sum of the data in A1 and A2 appearing in the cell. |
|
Using functions |
To use a function in a formula, open the Formula Builder by clicking on the ‘Insert Function’ button in the Formulas tab. From the list that appears, select the function you would like to use, and type in the cell references for the cells you would like to draw data from in the text boxes provided. Click on the ‘Done’ button when you are finished. ExampleA formula that uses the average function and a range of cells would appear as ‘=AVERAGE(C1:C5)’ in the Formula Bar. It’s solution would appear in the corresponding cell. |
|
Inserting a chart |
Excel has several types of charts, including column, line, and pie graphs, that you can create in a worksheet. You can access these options in the Insert tab, in the ‘Charts’ group. You can easily export a chart in a Word document by copying it and pasting it into the document. To insert a chart, select the range of cells you would like to use by clicking and dragging your mouse down to highlight the range. Click on the type of chart you would like to create from those displayed in the ‘Charts’ group in the Insert tab, and select an option from the dropdown that appears. Your chart will then appear in your worksheet. To edit and format a chart, select the chart by clicking on it and then click on either the ‘Design’ tab or ‘Format’ tab that appears. From these tabs, you can add chart elements, and change the chart layout, colour scheme and type. |